

A site goes down for four minutes at 14:32 on a Tuesday. By the time anyone looks, it is back up. No alert fired cleanly, the error rate graph shows a single narrow spike, and the support ticket says “the page was blank, then it worked.” This is the starting point for most of the incidents that never get properly explained, and it is also the exact scenario where a nginx, php-fpm, mariadb stack with a CDN in front of it stops being a simple web server problem and becomes an investigation.
Table of Contents
What actually breaks when nginx, php-fpm and mariadb fail together
The difficulty is not that any single layer is hard to read. Nginx access logs are plain text. Php-fpm has an error log and a slow log. Mariadb keeps a slow query log and an error log. Any of these, read alone, is manageable even by someone with a few months of production experience. The problem starts the moment two or more of these logs need to be read together, against a shared timeline, to explain one user-visible event. A 502 in the nginx error log might correspond to nothing unusual in php-fpm if the failure happened before php-fpm was ever reached. The same 502 might correspond to a php-fpm worker that was alive the entire time but blocked on a database lock that appears three log files away, in mariadb’s own error log, timestamped in a different timezone convention.
Each layer was designed by a different project, with a different logging philosophy, for a different failure model. Nginx logs what it did with a connection. Php-fpm logs what happened to a worker process. Mariadb logs what happened to a query or a transaction. None of these logs was designed with the assumption that someone would need to reconstruct a single end-to-end request by stitching all three together after the fact, often hours or days later, often without the request ID that would have made the join trivial.
Add a CDN in front of the origin and the problem compounds again. The CDN terminates the user’s connection, decides independently whether to serve from edge cache or forward to origin, and by default keeps none of that decision-making visible in the origin’s own logs. If the CDN served a stale cached response, nginx never even saw the request. If the CDN forwarded the request but stripped or normalized certain headers on the way, the origin sees a request that looks slightly different from what the user’s browser actually sent. Cookies compound it a third time: a single cookie value can silently change which cached variant of a page a user receives, whether a request bypasses cache entirely, or whether a session is treated as authenticated or anonymous by a layer that has no idea what “authenticated” means at the application level.
None of this is exotic. It is the default condition of running a moderately trafficked PHP application behind a CDN, which describes a large share of the production web. What makes it a job for an experienced team rather than a single competent developer is not any one of these mechanisms in isolation. It is the combinatorics: four semi-independent systems, each with partial visibility, each capable of producing symptoms that look like a problem in one of the other three. Retroactive diagnosis under these conditions is closer to forensic reconstruction than to conventional debugging, and it rewards people who have already seen enough of these patterns to recognize them quickly rather than re-derive them from first principles under pressure.
Defining the stack and where each layer’s responsibility ends
Before any log line means anything, it helps to be precise about what each component is actually responsible for, because most misdiagnoses come from assuming a layer did something it was never designed to do.
Nginx, in this stack, is the reverse proxy and web server. It terminates TLS, decides how to route a request based on server blocks and location rules, optionally serves static files directly, and passes everything else to php-fpm over FastCGI, usually through a Unix socket or a local TCP connection. Nginx’s job ends the moment it hands the request off. It does not know what the PHP application did with that request; it only knows how long it waited for a response and what status code came back, or whether it gave up waiting.
Php-fpm, the PHP FastCGI Process Manager, is a pool of worker processes that execute PHP code. Each worker handles exactly one request at a time — this is the single most important fact about php-fpm’s behaviour, and much of the rest of this article follows from it. A pool has a maximum number of children, and when all of them are busy, new requests queue at the socket level rather than inside php-fpm itself. Php-fpm’s job ends when it returns a response to nginx or crashes trying. It has no concept of what happened inside the database beyond the wall-clock time the PHP code spent waiting for a query to return.
Mariadb is the persistence layer. It executes queries, manages transactions, holds locks, and reports back success, failure, or a timeout. Mariadb has no visibility into HTTP at all. It does not know which URL triggered a query, which user was logged in, or which cache layer sat in front of the request. It knows a connection came from a given IP and executed a given statement in a given amount of time.
The CDN, when one is used, sits entirely outside this triangle. It intercepts requests before they reach nginx, decides based on cache rules, headers and its own configuration whether to answer from edge cache or forward the request onward, and — critically for diagnosis — keeps its own logs on infrastructure the origin operator frequently does not have direct query access to, particularly on shared or lower tier CDN plans.
Each of these four systems can be completely healthy in isolation while the combination produces a broken user experience. Nginx can report a clean 200 while php-fpm executed correctly but returned data that was stale because mariadb served a read from a replica lagging behind the primary. Php-fpm can report a normal-looking response time while the CDN cached that response for the wrong audience because of a missing Vary header. This separation of responsibility is precisely why no single log file, however carefully read, tells the whole story on its own. Diagnosis has to move laterally across systems that were never built to be read as one.
The CDN as an invisible fourth server nobody remembers to check
Teams that run their own nginx, php-fpm and mariadb servers usually have SSH access, root privileges, and the ability to tail any log file they want in real time. The CDN sitting in front of that stack is a different kind of system entirely: a third-party service, operated on infrastructure the client does not control, whose internal decision-making is deliberately abstracted away behind a small set of response headers and a dashboard.
This creates a specific and recurring diagnostic trap. When something goes wrong, the instinct is to look at the servers that are visible and controllable — nginx, php-fpm, mariadb — because those are the systems where logs can be tailed immediately and root cause feels reachable. The CDN, being one step removed, is often the last place anyone looks, even when it is the actual source of the problem. A request that never reached the origin at all, because the CDN served it from edge cache, will not appear in the nginx access log in any form. There is nothing to grep for. The absence of evidence at the origin is, in this specific case, the evidence.
Most CDNs expose some signal about their own caching decision through response headers: cf-cache-status on Cloudflare, x-cache on many others, Age indicating how long a response has sat in cache, and Via indicating which proxies handled the request. These headers are genuinely useful, but they only help if someone thought to capture them at the time of the incident, which in practice means either the affected user’s browser developer tools were open during the failure, or synthetic monitoring was already polling the endpoint and recording headers on every request. Neither condition holds for most incidents that get reported after the fact through a support ticket or a slow, vague pattern of complaints.
The deeper issue is that a CDN’s cache decision depends on state that is invisible to the origin: what was cached previously, under what cache key, with what TTL, and whether that entry has since expired, been purged, or is being served in a stale-while-revalidate window. Two users hitting what looks like the identical URL, from the same country, on the same day, can receive completely different cached responses depending on tiny variations in headers the CDN used to build its cache key. An origin team investigating purely from nginx and application logs is, in these cases, debugging half of the system while blind to the other half.
This is why any serious retrospective investigation into a caching-related incident has to start by asking what the CDN did, not what the origin did, and pulling CDN-side logs or analytics as a first step rather than a last resort. Teams that treat the CDN as a black box that “just delivers the site faster” consistently lose the most time in these investigations, because they spend it ruling out causes at the wrong layer before anyone thinks to check the layer that was actually responsible.
Cookies as the quiet variable that breaks caching assumptions
Cookies are the single most underestimated variable in caching-related incidents, precisely because they are invisible in the places engineers habitually look. A URL is visible in every log at every layer. A response body can be inspected. A cookie value, by contrast, travels inside a request header that many default log formats do not capture, and its effect on caching behaviour is determined by configuration that lives in a completely different system — the CDN or the reverse proxy cache — from the one that set the cookie in the first place, which is usually the PHP application or the session handler.
The mechanism is straightforward once it is stated plainly, but it produces confusing symptoms until it is understood. Most caching layers build a cache key from the request URL and, optionally, a defined set of headers or cookies specified through a Vary directive or equivalent cache-key configuration. If the presence of a Set-Cookie header on the origin response is not explicitly excluded from the caching decision, many caches will refuse to cache the response at all, treating any cookie-setting response as inherently personalized. This is a sane default from the cache’s perspective and a frequent source of “why is nothing caching” tickets, because a PHP session cookie is often set on every single page load by default, silently defeating a cache configuration that looks correct on paper.
The inverse problem is worse and harder to detect: a cache that does include a specific cookie in its cache key can end up creating one cached variant per unique cookie value. If that cookie happens to carry something close to a unique identifier — a session token, a per-visitor tracking value, an A/B test bucket assigned per session — the effective cache hit rate collapses toward zero even though the cache appears to be “working” in the sense that entries are being written and read. Every visitor effectively gets their own private cache entry, defeating the entire purpose of the cache while giving no obvious error anywhere in any log.
A third variant, and the one most likely to alarm a client, is content leaking across users because a cookie was not included in the cache key when it should have been. If a page’s content genuinely differs by cookie value — a logged-in state, a selected currency, a language preference — but the cache key does not account for that cookie, the first user to request the page determines what every subsequent user sees until the entry expires or is purged. This produces the specific, disturbing pattern of “user A saw user B’s account information,” which is almost never actually a data breach in the security sense and almost always a caching misconfiguration, though distinguishing the two definitively requires exactly the kind of cross-layer log correlation this article is about.
None of these three failure modes leaves an obvious trace in nginx or php-fpm logs, because from the origin’s point of view, every request looks legitimate and every response looks correctly generated. The bug lives entirely in the interaction between the cookie and the cache configuration, in a layer whose decision logic is not written to the origin’s disk at all. This is one of the clearest examples of why single-layer log reading fails: the evidence needed to diagnose the problem does not exist in the logs that are easiest to access.
A short history of the LEMP stack and why its debugging model never caught up
Nginx, PHP and MySQL-compatible databases were never designed as a unified system. Each project emerged separately, on its own timeline, solving its own narrow problem, and the “stack” is a naming convention applied after the fact by operators who chose to run them together because the combination performed well and was cheap to host.
PHP’s own execution model shaped the earliest debugging habits of an entire generation of web developers. In the mod_php era, a PHP error simply appeared in the web server’s own error log, because PHP executed as a module inside Apache. There was, in effect, one process and one log to check. Php-fpm’s separation of the PHP execution layer from the web server, adopted widely once nginx became a common front end because nginx cannot execute PHP modules directly, solved real performance and isolation problems but also split what used to be a single log stream into at least two, and often three once a dedicated slow log was enabled.
MySQL, and its later community fork MariaDB, developed their own logging conventions independently, driven by database administrators whose primary concern was query performance and replication integrity, not correlating a slow query with the specific web request that triggered it. The slow query log format, the error log format, and later the Performance Schema were all built by people optimizing for database-centric questions: which query pattern is expensive, which table is locked, which replica is lagging. None of it was designed with an HTTP request ID in mind, because at the time these logging systems matured, MySQL was already in wide use well beyond web applications, in contexts where there was no HTTP request to correlate against at all.
CDNs entered this picture later still, largely in the 2010s, as a layer added on top of an already-established LEMP deployment rather than as a component designed alongside it. Reverse proxy caching itself predates CDNs by years — Varnish and Squid were solving similar problems earlier — but the CDN model of geographically distributed edge nodes with centrally managed configuration introduced a genuinely new kind of visibility gap: the cache decision now happened on infrastructure the origin operator did not own, could not tail in real time by default, and in many cases had to pay extra to gain detailed logging access to at all.
The consequence of this uncoordinated history is that the tools available today for reading each layer’s logs are individually mature and well documented, while the tooling and shared conventions for reading them together lag noticeably behind. Structured logging, correlation IDs, and distributed tracing exist and are well understood in principle, covered later in this article, but retrofitting them onto an existing nginx, php-fpm, mariadb deployment that grew organically over years is optional work that most teams never prioritize until an incident makes the absence painfully obvious. The debugging model most engineers inherited assumes one log, one process, one clear causal chain — a model that fit mod_php reasonably well and fits almost nothing about a modern CDN-fronted deployment.
Reading an nginx access log correctly, and what most engineers skip
The default nginx access log format captures the remote address, timestamp, request line, status code, bytes sent, referrer and user agent. This is enough to answer simple questions — did the request arrive, what status did it get, how big was the response — and it is where almost every investigation begins, because it is almost always the log that is easiest to reach.
What the default format does not capture is frequently more important than what it does. It does not include the upstream response time by default, which means there is no way to tell, from the access log alone, whether a slow response was slow because php-fpm took a long time or because of something else entirely, such as network latency between nginx and the client. It does not include the cache status of the request unless a custom log format has been configured to add it, which means a cache hit and a cache miss look identical in the standard log even though they represent entirely different code paths. And critically, it does not include a request ID or correlation identifier unless one has been explicitly added, which means there is no built-in way to find the corresponding lines in the php-fpm or mariadb logs for a specific request without matching on timestamp and client IP, an approach that becomes unreliable the moment two requests from the same IP arrive within the same logging second, which happens constantly on any site with meaningful traffic.
A properly configured production nginx setup extends the log format to include at minimum $upstream_response_time, $request_time, and — when a cache or CDN sits in the path — the relevant cache status variable or header. Adding $request_id and propagating it to php-fpm as a header that gets logged there too is the single highest-value change most teams can make to their logging setup, because it converts a fuzzy timestamp-and-IP correlation exercise into an exact join across log files. Few teams do this before their first serious multi-layer incident. Most do it immediately after.
The other habit that separates experienced diagnosticians from less experienced ones is reading the access log for absence, not just presence. A gap in the access log during a period when the site was reportedly down, with no corresponding entries in nginx’s error log either, points strongly toward a failure that happened before the request reached nginx at all — a CDN outage, a DNS problem, a network-level block, or a load balancer routing requests elsewhere. This is a genuinely common pattern and a genuinely common source of wasted time, because teams instinctively start reading php-fpm and mariadb logs for a period during which those systems never received a single request to fail on. Confirming that a request actually arrived at each layer, in order, before investigating what that layer did with it, is the discipline that prevents hours of misdirected effort.
Volume is the final obstacle. A moderately trafficked site can produce access log entries numbering in the tens of thousands per hour, and a genuine incident often has to be found within a narrow window inside that volume, frequently without knowing the exact minute in advance because the user report says only “sometime this afternoon.” Grep and manual scanning work at small scale and become impractical past it, a limitation covered in more detail later in this article, but it is worth noting here that this scale problem starts at the very first layer, before any cross-referencing with php-fpm or mariadb has even begun.
Reading an nginx error log for socket, upstream and timeout failures
Where the access log describes what happened to requests that completed, the nginx error log describes the failures that prevented a normal response — and it is here that the distinction between a 502 and a 504 becomes genuinely diagnostic rather than cosmetic.
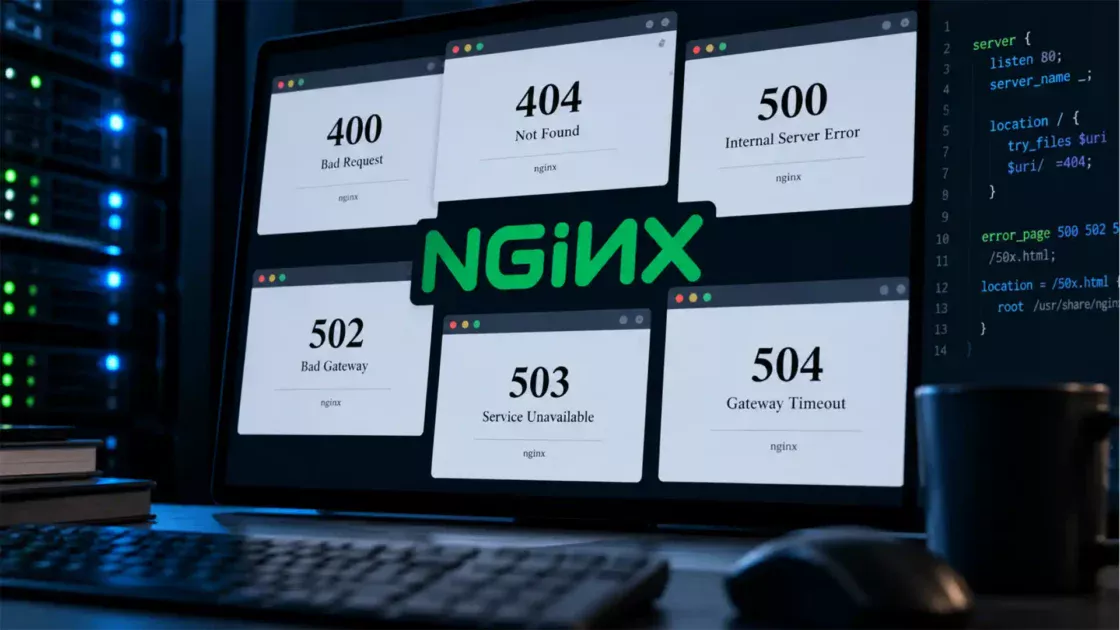
A 502 Bad Gateway means nginx could not establish or maintain a connection to php-fpm at all. The FastCGI socket may be missing because php-fpm crashed or was restarting, the connection may have been refused because the socket’s backlog queue is full, or the php-fpm master process itself may be down. Critically, a 502 tells you the failure happened before any PHP code executed for that particular request, which means searching the php-fpm error log or slow log for a matching entry is often a waste of time; there may be nothing there to find, because php-fpm never accepted the request in the first place.
A 504 Gateway Timeout is a different failure with a different implication. It means the FastCGI connection was established successfully and the request was handed to a php-fpm worker, but nginx’s fastcgi_read_timeout elapsed before a response arrived. This is a meaningful distinction: the problem is not connectivity, it is that something the worker was doing — most often waiting on a database query, an external API call, or a locked resource — took longer than the configured timeout. Here, the php-fpm and mariadb logs from the same window become directly relevant, because the slow operation almost always left a trace in one of them, assuming the relevant logging thresholds were configured low enough to catch it.
A subtlety that catches out less experienced operators: when nginx times out and closes its side of the connection, php-fpm is not automatically informed. The worker can continue executing, complete its work, and write a response to a socket that nginx has already abandoned. This produces what is sometimes called a phantom worker — a php-fpm process that appears busy in monitoring long after the user-facing request has already failed, consuming a slot in the worker pool for work whose result will never be delivered. Under sustained load, an accumulation of phantom workers can exhaust the entire pool, causing a wave of 502s for completely unrelated, otherwise healthy requests. This is one of the clearest examples in this stack of a failure that originates in one layer, is caused by a timing mismatch with another layer, and manifests as a symptom in a third set of requests that had nothing to do with the original slow operation.
The nginx error log will also surface upstream connection resets, worker process crashes at the nginx level itself, and configuration errors that only manifest under specific request patterns — a regular expression in a location block that behaves unexpectedly against a URL nobody tested, for instance. These are comparatively rare relative to socket and timeout issues but worth ruling out early, because they are quick to check and, unlike timing-related bugs, tend to be deterministic and reproducible once identified, which makes them one of the few genuinely fast wins available in an otherwise slow investigative process.
What php-fpm actually logs and why the defaults hide the real story
Php-fpm’s default logging configuration is conservative to the point of being diagnostically thin. Out of the box, it logs pool startup and shutdown events, worker crashes with a signal number, and PHP-level fatal errors if error_log is configured to write there. It does not, by default, log how long each request took, how many workers were busy at the time, or how close the pool was to exhausting its pm.max_children limit — all of which are frequently the actual answer to “why was the site slow.”
This gap matters because php-fpm’s concurrency model is process-based: each worker handles exactly one request from start to finish, and the pool size is a hard ceiling. When all workers are occupied, additional requests do not queue inside php-fpm in any visible way; they queue in the underlying socket’s listen backlog, a kernel-level structure that most default monitoring never inspects. Once that backlog itself fills, the kernel begins refusing new connections outright, and from nginx’s perspective this looks identical to php-fpm being completely down, producing a 502 with no corresponding php-fpm log entry at all, because the request was rejected before php-fpm’s own logging had any opportunity to record it.
The signal that would explain this — worker pool saturation — has to be enabled deliberately. Setting pm.status_path exposes a live status page reporting active processes, idle processes, and whether max_children has been reached recently; without this enabled in advance, there is no way to reconstruct pool saturation after the fact, because the state was never recorded anywhere. This is a recurring theme across this entire stack: many of the most useful diagnostic signals are opt-in, and the cost of not opting in is invisible until the exact moment an investigation needs the data that was never being collected.
Worker crashes are logged with more detail than most other events, and the log line format is distinctive enough to search for directly: a WARNING entry naming the pool, the child process ID, the exit signal, and how many seconds the worker had been running before it died. A SIGSEGV after a few hundred microseconds of runtime typically points to a native extension bug — often something in a PDO driver or an image processing library — rather than anything in the PHP application code itself, because pure PHP script errors surface as catchable fatal errors rather than process-level signals. A SIGKILL, by contrast, usually indicates the operating system’s out-of-memory killer intervened, which redirects the investigation toward memory consumption patterns rather than the request logic.
Php-fpm also logs when it reaches emergency_restart_threshold — a safety mechanism that restarts the entire pool if too many workers crash within too short an interval, intended to guard against a corrupted opcode cache causing cascading failures. This particular log event is easy to miss because it looks like routine maintenance rather than an incident, but a pool-wide emergency restart during a period when users reported the site being unavailable is a strong signal that the underlying cause was a crash loop rather than a slowdown, and it points the investigation toward whatever code path or extension was executing across the crashing workers, information that is unfortunately not recorded in the emergency restart log entry itself and has to be reconstructed from the individual crash warnings that preceded it.
The php-fpm slow log and why it lies about causality
Enabling slowlog alongside request_slowlog_timeout gives php-fpm the ability to record a full PHP stack trace for any request that exceeds a configured duration, and it is one of the most valuable single settings available in this stack for retroactive diagnosis, because it captures exactly where in the application code time was spent, down to the function call. It is also, if read carelessly, one of the easiest sources of a confidently wrong conclusion.
The trap is this: the slow log shows where the PHP interpreter’s program counter was sitting when the timeout fired, which very often is a line of code making a database call, an external HTTP request, or a file operation. It is tempting, and usually wrong, to conclude that the line of code itself is the slow operation — that the query is badly written, or the API call is poorly implemented. In reality, the PHP code is frequently doing exactly what it always does; what changed is how long the thing it was waiting on took to respond. A query that normally completes in ten milliseconds and shows up in a slow log entry after eight seconds is not, in most cases, a query that suddenly needs an index. It is far more often a query that queued behind a lock held by a different, unrelated transaction, or a database connection pool that was exhausted, or a replica that had fallen behind under replication lag.
This is precisely why the php-fpm slow log cannot be read in isolation and treated as a verdict. Its correct use is as a pointer: it identifies which request was slow and where execution was stuck, and that information then has to be cross-referenced against the mariadb logs from the same narrow time window to determine whether the database was itself slow to execute the query, or merely slow to make a connection available, or blocked on a lock held by something else entirely. Skipping this cross-reference and acting directly on the slow log’s stack trace — adding an index, rewriting a query — is a common and costly mistake, because it treats a symptom’s location as its cause, and the fix frequently does nothing measurable because the actual bottleneck was never in the query itself.
A second limitation worth flagging: the slow log only captures requests that exceed the configured threshold, and that threshold is a single global value per pool in most configurations. Set it too high and genuinely important slow requests during a degraded period go unrecorded because they finished just under the bar. Set it too low and the log fills with routine variance that obscures the requests that actually mattered, while also adding measurable overhead to every request in high-traffic pools, since capturing a full stack trace is not free. Tuning this threshold well requires already having a working sense of the application’s normal latency distribution — which is itself something most teams only build up empirically, over time, precisely by having lived through a few of these incidents rather than by following a generic guideline.
Mariadb’s three logs and when each one actually matters
Mariadb, like its predecessor MySQL, keeps three logs that matter for incident diagnosis, and each answers a different question. Conflating them, or checking only the most familiar one, is a common source of stalled investigations.
The error log records server-level events: startup and shutdown, crashes, replication errors, and warnings about configuration problems such as running out of file descriptors or table cache slots. This is the log to check first when the database itself appears to have been unavailable, restarted unexpectedly, or lost a replication connection, and it is usually the smallest and easiest of the three to read in full during an incident window.
The slow query log records individual statements that exceeded a configured long_query_time threshold, along with how long they took, how many rows were examined, and how many were returned. This is the log most engineers reach for by default, and for genuinely slow, badly indexed queries it is the right tool. Its limitation is that it only captures execution time for statements that actually ran to completion past the threshold; a query that was queued for eight seconds waiting on a lock and then executed in five milliseconds once the lock released may not appear as a slow query at all, depending on whether lock wait time is included in the timing MariaDB uses for the threshold, which is a frequent source of confusion when the slow query log shows nothing unusual during a period that was, by every other measure, clearly a database-driven incident.
This is where the Performance Schema becomes necessary rather than optional. Tables such as events_statements_summary_by_digest provide cumulative, per-query-pattern statistics — total time, call count, rows examined — that exist independently of the slow query log’s threshold, making it possible to identify a query pattern that is individually fast but collectively expensive because it runs an extreme number of times, a pattern the slow query log is structurally unable to surface since no single execution ever crosses the slow threshold. Tools built on top of these sources, most notably Percona’s pt-query-digest run against a slow log, or direct queries against Performance Schema digest tables, group executions by fingerprint and rank them by total impact rather than by any single execution’s duration, which is almost always the more useful ranking during a real investigation.
Log locations and default behaviour across the stack
| Layer | Default log location | Captures by default | Needs explicit enabling |
|---|---|---|---|
| Nginx | /var/log/nginx/access.log, error.log | Status, timing (partial), errors | Upstream timing, request ID, cache status |
| Php-fpm | /var/log/php-fpm/*.log | Crashes, fatal errors | Slow log, pool status page |
| Mariadb | /var/log/mysql/error.log | Server errors, restarts | Slow query log, Performance Schema detail |
| CDN | Provider dashboard / API | Aggregate cache stats | Per-request logs (often a paid tier) |
The table above is a starting point rather than a checklist to memorize, and the specific paths vary by distribution and installation method. What it is meant to convey is the pattern: almost every genuinely useful diagnostic signal in this stack is off by default, and the gap between a stack that is easy to debug and one that is nearly impossible to debug retroactively is almost entirely a matter of which of these optional settings were turned on before the incident happened, not during it.
Why timestamps rarely agree across servers and what that does to an investigation
Every log correlation technique described so far depends on one assumption that is rarely tested until it fails: that the timestamps written by nginx, php-fpm, mariadb and the CDN all describe the same moment in real time. In practice, this assumption is wrong more often than most teams expect, for reasons that have nothing to do with the application itself.
Servers can be configured with different timezones, and even when every system is nominally set to UTC, log formats vary in whether they record local time, UTC, or an offset-annotated timestamp, and whether that timestamp has second or sub-second precision. A common and genuinely maddening variant of this problem occurs when nginx is configured to log in the server’s local timezone while mariadb logs in UTC, and nobody documented which is which; an investigation that assumes both are in the same zone will consistently misalign events by whatever the offset happens to be, sometimes concluding that a database event happened after the web request that supposedly triggered it, which is logically impossible and should be the first clue that a timezone mismatch, not a genuine causality violation, is at fault.
Even when timezones are correctly aligned, clock drift introduces a second, subtler version of the same problem. Two servers can each be individually well-behaved — both synchronized to NTP, both reporting sensible timestamps — while still disagreeing with each other by tens or hundreds of milliseconds, because NTP corrects drift gradually rather than instantaneously and different hardware clocks drift at different rates between synchronization cycles. This kind of misalignment is invisible under normal operation and only becomes consequential during exactly the kind of fine-grained, millisecond-sensitive correlation that a retroactive multi-layer investigation requires — trying to determine, for instance, whether a database lock was acquired eleven milliseconds before or after a specific php-fpm worker started waiting on it.
The practical consequence is that an investigator who treats timestamps as exact and builds a strict chronological ordering across systems can end up with a plausible-looking but wrong sequence of events, particularly under load, where multiple similar events genuinely do occur within the same second across different servers. The correct discipline is to treat cross-server timestamp ordering as approximate by default, with an explicit margin of error, and to prefer relative ordering derived from a shared identifier — a request ID, a transaction ID — over absolute timestamp comparison whenever one is available. Where no shared identifier exists, which is unfortunately the common case in stacks that were never instrumented for this purpose, the investigator has to fall back to timestamp correlation anyway, but with appropriate skepticism about conclusions that depend on ordering two events that are less than a second or two apart.
This is one of the reasons cross-layer incident diagnosis resists being reduced to a simple procedure. It requires a working awareness of exactly where the underlying data can mislead, which is a form of expertise built through direct experience with false leads rather than something that can be fully captured in a runbook.
Clock synchronization, NTP drift and the forensic cost of unsynchronized logs
NTP, the Network Time Protocol, keeps a server’s clock aligned to an authoritative time source, typically maintaining synchronization within roughly a millisecond on a well-behaved local network. It does this by slewing the clock — adjusting its rate gradually — for small offsets, and only stepping the clock, producing a visible jump, when the accumulated offset crosses a threshold commonly set around 128 milliseconds. This design choice matters for log correlation specifically: because small drift is corrected smoothly rather than in a single visible jump, a server’s clock can be measurably wrong relative to its peers for extended periods without anything in its own logs indicating a problem.
If NTP synchronization is blocked entirely — a firewall rule silently dropping UDP port 123 traffic, for instance, since NTP has no TCP fallback — a server’s clock free-runs on its local oscillator, drifting at a rate determined by the quality of that hardware clock, commonly on the order of tens to low hundreds of milliseconds per day for typical server-grade components. Over a period of weeks without correction, this can accumulate into multi-second discrepancies, all while every other indicator on the server looks completely normal: it stays up, it serves traffic, it responds to health checks. The drift produces no alert of its own; it only becomes visible when someone tries to correlate that server’s logs against another server’s logs during an investigation and the timeline stops making sense.
This is directly relevant to compliance frameworks that operators of these stacks are increasingly expected to meet. ISO 27001’s Annex A control 8.17 requires organizations to synchronize the clocks of information-processing systems to an approved time source specifically because log correlation, forensic investigation, and authentication protocols such as Kerberos and time-based one-time passwords all depend on it. The control exists because the failure mode is well understood industry-wide: unsynchronized clocks do not just slow down an investigation, they can make specific cross-system event ordering unprovable, which matters both for internal root-cause work and for any situation where log timestamps might need to stand as evidence — in a contractual dispute over an SLA breach, in an insurance claim following a security incident, or in a regulatory inquiry.
The remediation is not exotic — running a proper NTP or Chrony client against a reliable pool of time servers, monitoring drift rather than assuming synchronization is permanent, and alerting when a host’s offset exceeds a sane threshold — but it is exactly the kind of unglamorous infrastructure hygiene that tends to be skipped on smaller deployments until an incident makes its absence expensive. A team investigating a cross-layer incident for the first time on a given stack frequently discovers the clock drift problem only when their carefully reconstructed timeline contradicts itself, at which point they have to redo part of the analysis with a wider, more forgiving time margin, costing hours that proper time synchronization, configured months earlier, would have avoided entirely.
Correlation IDs and request tracing as the fix nobody retrofits in time
The single technical change that most directly solves the cross-layer correlation problem described throughout this article is also one of the least frequently implemented on existing LEMP deployments: a correlation identifier, generated once at the edge of the system and propagated, unchanged, through every layer that touches the request.
The mechanism is simple in concept. Nginx can generate a unique value for every incoming request using its built-in $request_id variable, or accept and forward an existing identifier if the CDN or a load balancer upstream already set one — commonly via an X-Request-ID header, though traceparent, the W3C Trace Context standard header, is increasingly used because it embeds a trace ID and span ID in a standardized, cross-vendor format rather than an ad hoc convention. That identifier is then passed to php-fpm as a request header, included in the PHP application’s own logging — including, critically, any custom logging the application does around its own slow operations — and ideally passed through to mariadb as a comment embedded in the query itself, since MariaDB has no native concept of an out-of-band request context to attach to a query automatically.
Once this is in place, an investigation that previously required approximate timestamp matching and educated guessing becomes a direct, exact lookup: take the request ID from a user’s error report or from the nginx access log entry that shows the failure, and search every other log source for that same string. What used to be probabilistic correlation, always vulnerable to the clock drift and volume problems described earlier, becomes a deterministic join across systems that otherwise share nothing in common.
The reason this is rarely implemented before it is needed is mundane rather than technical: it requires coordinated changes across the nginx configuration, the PHP application’s logging setup, and often the database access layer, none of which is glamorous work and none of which visibly improves anything under normal operation. It only pays for itself during an incident, which means it competes poorly for engineering time against features and fixes with immediate visible value — until the first incident that takes six hours to diagnose instead of forty minutes makes the case for it retroactively and painfully.
Distributed tracing systems built on top of this same idea — Jaeger, Zipkin, or commercial observability platforms that ingest OpenTelemetry data — extend the concept further, capturing not just a shared identifier but a full timing breakdown of every hop a request took, visualized as a single connected trace rather than a set of log lines a human has to mentally reassemble. For a stack of this complexity, the honest assessment is that manual log correlation without a shared request identifier is not merely slower than tracing-based diagnosis, it is a fundamentally weaker technique that will eventually produce a wrong conclusion under sufficiently ambiguous conditions, simply because it depends on inference rather than direct evidence. Teams that have been burned by exactly this tend to prioritize the instrumentation work immediately afterward; teams that have not yet been burned by it tend to keep deferring it, which is itself a predictable and observable pattern across the industry.
Why a single symptom can have four unrelated causes at once
A recurring source of wasted investigation time is the assumption that a given symptom has one cause, and that once a plausible explanation is found, the search is over. In a stack with this many interacting layers, the same visible symptom routinely has several genuinely different underlying causes, and a superficially convincing explanation found early in the investigation can be entirely wrong while still fitting the available evidence.
Take intermittent 502 errors as a concrete example, since it is among the most commonly reported symptoms in this stack. A 502 can be caused by php-fpm’s worker pool being exhausted under load, by php-fpm crashing due to a native extension bug, by the operating system’s out-of-memory killer terminating a worker mid-request, by a misconfigured fastcgi_pass directive intermittently pointing at a stale socket path after a deployment, or by phantom workers accumulating after a spate of nginx-side timeouts and eventually saturating the pool for entirely unrelated requests. All five produce the identical status code and, from a user’s perspective, an identical experience: the page failed to load. Distinguishing between them requires different evidence from different logs, and treating the first plausible explanation as final risks fixing a problem that was not actually occurring, while the real cause continues undetected until the next occurrence.
The same pattern applies to “the site was slow.” This could be a database issue — lock contention, replication lag, an inefficient query suddenly running against a larger dataset than when it was written — or a php-fpm issue with no database involvement at all, such as an external API call the application depends on that started timing out. It could be a network issue between the origin and a CDN experiencing regional problems, invisible in every origin-side log because the origin never saw the affected requests. It could even be a client-side perception issue with no server-side slowness at all, where a CDN edge node in a specific region degraded while every metric at the origin, quite correctly, showed nothing wrong.
This multiplicity of plausible causes is precisely why experienced diagnosticians resist committing to a single hypothesis early and instead try to gather disconfirming evidence for each candidate explanation before settling on one. A hypothesis that is merely consistent with the available evidence is a weak basis for a fix; a hypothesis that survives an active attempt to rule it out is a much stronger one. In practice this means checking the php-fpm pool status history even when the mariadb slow log already shows something suspicious, and checking CDN cache status headers even when a database explanation seems sufficient, because in a system this interconnected, more than one of these factors is often present simultaneously, and the actual failure was a combination — a database slowdown that would have been survivable on its own, compounded by a pool size that was already too small for the traffic pattern, made worse by a CDN cache-bypass rule that had quietly stopped absorbing load it used to absorb.
Case pattern: a 502 that is actually a database lock wearing a web server’s clothes
Consider a pattern that recurs often enough across different clients and platforms to be treated as a template rather than an anecdote. A site running WooCommerce or a similar PHP e-commerce platform begins throwing intermittent 502 errors during a promotional sale, precisely when traffic is highest and the cost of downtime is greatest. The nginx error log shows a wave of upstream connection failures. The instinctive, and wrong, first move is to assume php-fpm’s pool is simply too small for the traffic and to raise pm.max_children, which frequently makes the situation worse rather than better.
The actual chain of causation, uncovered by cross-referencing the php-fpm slow log against the mariadb error log and Performance Schema for the same narrow window, often looks like this: a specific checkout-related query — frequently one that updates stock counts or reserves inventory — briefly holds a row lock while a transaction completes. Under normal traffic, this lock is held for a few milliseconds and no one notices. Under sale-level concurrency, many checkout requests hit the same inventory row simultaneously, and each one queues behind the previous transaction’s lock. Php-fpm workers do not fail when they are waiting on a lock; they simply sit blocked, executing nothing, for however long the queue takes to clear. From nginx’s perspective, these workers are indistinguishable from workers doing legitimate, productive work — the FastCGI connection is open, nothing has crashed, nginx just eventually times out waiting for a response that never comes in the configured window.
The compounding effect is what turns a database-level slowdown into a stack-wide outage. As workers queue behind the lock, the pool’s available capacity shrinks, and requests that have nothing to do with checkout — someone browsing the catalog, someone loading the homepage — start queuing behind the socket’s listen backlog because every worker is occupied waiting on an unrelated lock. Raising pm.max_children in response does not resolve the underlying lock contention; it only allows more workers to pile up waiting on the same lock, consuming more memory in the process and, in sufficiently severe cases, exhausting the server’s RAM and triggering the operating system’s out-of-memory killer, which introduces an entirely new class of crash-related log entries that make the original cause even harder to spot in retrospect.
The correct fix in cases like this usually involves the database and application layer, not the web server tier at all: reducing the duration locks are held by restructuring the transaction, using row-level locking more precisely, adding a queue or a compare-and-swap pattern for the specific hot resource, or in some cases accepting eventual consistency for the stock count and reconciling it asynchronously. None of this is discoverable from the nginx or php-fpm logs alone. The 502 is real, the php-fpm connection failure is real, but the actual root cause is a database design decision that only becomes visible once someone thinks to correlate the exact timestamp of the failing requests against lock wait events in mariadb, which is precisely the kind of cross-layer reasoning that separates a fast, correct fix from weeks of throwing infrastructure at a problem infrastructure cannot solve.
Case pattern: a stale cache that only appears for logged-in users
A second recurring pattern involves a symptom that is genuinely confusing on first contact because it defies the usual assumption that a bug either affects everyone or affects no one: a subset of logged-in users report seeing content that is clearly out of date — an old price, a stale account balance, someone else’s name in a greeting — while anonymous visitors and most other logged-in users see the page correctly.
The investigation typically begins, reasonably, by suspecting the application itself: a database read replica lagging behind writes, an object cache like Redis holding a stale value past its intended expiry, or a bug in how the session is loaded. These are all legitimate things to check and are sometimes the actual cause. But in a meaningful share of cases that fit this exact pattern, the real culprit sits one layer further out, in the CDN or reverse proxy cache, and the reason it takes longer than it should to find is that the origin’s own logs show absolutely nothing wrong, because the origin never generated the stale response the user is seeing — it generated it once, correctly, some time earlier, and the cache has simply been serving that same response ever since to a set of users whose requests never reached the origin again.
The mechanism, once identified, is usually a cache key that does not fully account for the dimension along which the content actually varies. If the CDN’s cache key is built from the URL and a small set of headers, but the content differs based on a cookie carrying account-specific state, and that cookie is not included in the cache key, then the first user’s request after a cache miss determines what every subsequent visitor with a different cookie value sees, until the entry expires or is explicitly purged. The origin, for its part, may have correctly set a Vary header or cache-control directive — the misconfiguration frequently lives entirely on the CDN side, in a caching rule that overrides or ignores what the origin actually sent, which is common on CDN plans where cache behaviour is controlled through a separate rules engine rather than deferring fully to origin headers.
Diagnosing this pattern requires checking, specifically, whether the affected users’ requests reached the origin at all during the period they reported the stale content — a question the origin’s access log answers cleanly if the request IDs or timestamps line up, and answers with silence, meaning no matching entry exists, if the cache served the response without ever forwarding the request. That silence is itself the diagnostic signal, but only to someone who thinks to look for it, because the natural instinct when investigating “user saw wrong data” is to look harder at the systems that generate data, not at the layer whose entire job is to avoid generating anything at all when it can serve a cached copy instead. The fix is almost always a cache-key or Vary-header change on the CDN configuration, occasionally paired with an explicit purge of the specific poisoned entries, and essentially never a code change to the application that generated the (correct, at the time) response the cache is still serving.
Case pattern: intermittent failures that vanish the moment someone starts watching
The third recurring pattern is, in some ways, the most frustrating for teams to experience and the most instructive to understand: a failure reported reliably by users over several days that becomes stubbornly unreproducible the moment an engineer sits down to actively watch for it, tails the relevant logs, or opens a browser to test the affected flow directly.
This is rarely coincidence, and it is rarely a case of unreliable user reports either. The far more common explanation is that the act of investigating changes the conditions under which the bug occurs. A staging or manual test request, made by a single engineer from a single location, does not recreate the traffic concurrency that triggers a lock contention issue like the one described earlier, so a bug that only appears when many simultaneous checkout requests contend for the same row simply does not manifest when there is only one request in flight. A caching bug tied to a specific cookie value or session state will not reproduce if the engineer testing it is logged out, using a fresh browser session, or testing from an IP address the CDN or WAF treats differently than a typical user’s — some CDN and security configurations explicitly exempt known internal or monitoring IP ranges from certain caching or rate-limiting rules, which is sensible for avoiding false alerts but actively unhelpful when that same exemption prevents an engineer from reproducing the exact conditions a real user experienced.
Time-of-day and load-dependent effects compound this further. A problem that only appears during genuine peak traffic — a specific hour when a marketing email goes out, or a lunch-hour spike in a particular timezone — is, by construction, absent during the quieter periods when most manual investigation happens, unless the investigator deliberately schedules their observation to overlap with the known high-traffic window, which requires already having a working hypothesis about timing that not every investigation starts with.
The practical implication is that live observation is a weak tool for this category of bug, and after-the-fact log analysis, painstaking as it is, is often the only reliable path to a diagnosis, precisely because logs captured passively during the actual failure reflect the real conditions, while any attempt to reproduce the failure on demand risks failing to recreate the concurrency, session state, or traffic pattern that caused it in the first place. This is also why the earlier point about enabling detailed logging — pool status pages, slow logs with appropriate thresholds, extended access log formats — before an incident happens matters so much: by the time a pattern like this is recognized as recurring rather than a one-off fluke, the only usable evidence is whatever was already being recorded during the previous occurrences, and nothing captured afterward, however carefully, can substitute for data that was never written down.
How CDN edge caching decisions are made and why origin logs cannot see them
A CDN’s edge caching decision is the outcome of a small set of interacting rules, and understanding that decision process in outline is necessary before it becomes possible to diagnose when it goes wrong, because origin-side logs, by design, capture none of it directly.
At the simplest level, a CDN checks whether it already holds a cached entry matching the incoming request’s cache key. If it does, and that entry has not exceeded its time-to-live, it serves the cached response directly and the origin never sees the request at all — this is the case responsible for the “invisible request” problem discussed earlier. If no valid cached entry exists, the CDN forwards the request to the origin, receives a response, and then decides whether that response is cacheable at all, based on the response’s own headers: a Cache-Control directive of private or no-store typically prevents caching outright, a Set-Cookie header on the response often does the same unless explicitly overridden in the CDN’s configuration, and the presence or absence of a Vary header determines which additional request headers, if any, get folded into the cache key for future requests to the same URL.
Cache keys themselves are more configurable than most operators realize, and this configurability is exactly where mismatches between intention and behaviour tend to hide. Many CDNs, by default, exclude high-cardinality headers like Cookie, Authorization, and User-Agent from the cache key specifically to avoid the effective cache-hit-rate collapse described earlier, which is a sensible default for content that genuinely does not vary by those headers, but becomes a source of exactly the stale-content and cross-user leakage bugs described in the case patterns above when the content does vary along a dimension the cache key does not account for. Some CDNs also apply request coalescing, deliberately caching a response only after a URL has been requested a small number of times within a short window, specifically to avoid caching one-off or low-traffic requests — a reasonable optimization for hit-rate efficiency that nonetheless means a resource can behave as uncached for its first two or three requests and then abruptly start being served from cache, a transition that looks, from the outside, like inconsistent or flaky behaviour rather than the deliberate policy it actually is.
None of this decision-making writes a trace to the origin’s disk, because the origin is, by definition, only involved in the cache-miss path. This is the structural reason CDN-side logs or analytics access is not optional for serious diagnosis of caching-related incidents; it is the only place this decision process is recorded at all. Most CDN providers offer some level of logging access — real-time logs, log push to an external storage bucket, or at minimum aggregate cache-hit-ratio analytics — but the depth of detail available frequently correlates directly with the pricing tier, and teams on lower tiers can find themselves needing exactly the kind of granular, per-request cache decision logging that their current plan simply does not expose, turning a technical diagnosis into a procurement conversation mid-incident.
The Vary header, cache keys and how cookies fragment a supposedly simple cache
The Vary header deserves a closer, more technical look than the general treatment given earlier, because it is simultaneously one of the most important tools for correct caching and one of the most common sources of confusing, hard-to-reproduce bugs, and understanding exactly what it does removes a substantial amount of the mystery around caching incidents in this stack.
Vary is a response header, set by the origin, that instructs any downstream cache — a CDN, a reverse proxy, or even the browser’s own cache — that the response’s content depends not only on the request URL but also on the value of one or more specific request headers, and that the cache should therefore treat requests with different values of those headers as needing separate cache entries, even though the URL is identical. Vary: Accept-Encoding is the most common and least troublesome example: it tells the cache that a gzip-compressed response and an uncompressed response for the same URL are different things and should not be served interchangeably, which is both correct and low-cardinality, since Accept-Encoding only takes on a handful of realistic values.
The trouble starts when Vary is applied to a header with much higher cardinality, and cookies are the extreme case, since a Cookie header can take on effectively as many distinct values as there are visitors with distinct session identifiers. A cache that respects Vary: Cookie literally, keying on the entire cookie header rather than a specific cookie name within it, will treat every visitor’s session cookie as a distinct cache dimension, producing one cache entry per visitor and reducing the effective cache hit rate toward zero — which is functionally equivalent to having no cache at all, while still incurring the overhead of checking the cache on every request. This is precisely why most caching systems, correctly, do not offer a simple way to vary on an individual cookie name rather than the entire header out of the box, and why doing so properly usually requires either application-level logic that normalizes the relevant cookie into a dedicated header before the cache sees it, or a CDN feature specifically designed for this purpose, since naive configuration nearly always produces one of the two failure modes described earlier: either everything is treated as uncacheable, or everything is cached per-user and effectively uncached in practice.
Getting this right requires a genuinely precise understanding of exactly which cookies actually affect content and which do not — a marketing tracking cookie set alongside a session cookie should almost never be part of a cache key, while a currency-selection cookie that changes prices displayed on the page absolutely must be, and conflating the two, treating all cookies as equally cache-relevant or equally irrelevant, is the single most common root cause behind both the “cache never works” and the “cache leaks data between users” categories of incident described in the case patterns above. This is not a setting to configure once and forget; it needs to be revisited every time a new cookie is introduced into the application, whether by the team’s own code, a marketing tag manager, or a third-party script, because each new cookie is, by default, invisible to whoever configured the cache and therefore a candidate for exactly this class of bug until someone deliberately accounts for it.
Web cache poisoning and cache deception as the security cousin of caching bugs
Everything covered so far treats cache misconfiguration as an operational problem — a bug that hurts performance or occasionally shows the wrong content to the wrong user by accident. The same underlying mechanisms, when discovered and exploited deliberately by an attacker rather than triggered accidentally by ordinary traffic, become a genuine security vulnerability, and any team investigating caching incidents needs to be able to distinguish an accidental misconfiguration from active exploitation, because the two require entirely different responses.
Web cache poisoning exploits exactly the unkeyed-header problem described in the sections above, but deliberately. If a cache’s key does not include a particular header or cookie, but the origin application reflects that header’s value into the response in some way — echoing it into a JavaScript variable, using it to construct a redirect URL, or including it in rendered HTML — an attacker can send a single crafted request containing a malicious payload in that unkeyed header, wait for the cache to store the resulting poisoned response, and then have every subsequent legitimate visitor served that same malicious content until the cache entry expires or is purged. A well-documented pattern involves a Cookie value that a cache does not key on but that the application reflects back into the page, allowing an attacker to inject a cross-site scripting payload once and have it served automatically to every user who loads the same cached page afterward, with no further action required from the attacker and no indication to affected users that anything unusual has happened, since the page loads normally from their perspective.
Cache deception, a related but distinct attack, works in the opposite direction: rather than poisoning a cache with malicious content, an attacker tricks a cache into storing a response that was never meant to be cacheable at all — a page containing a user’s private account information, for instance — by appending a static-looking path segment to a dynamic URL in a way that causes the cache to treat the response as a cacheable static asset. If successful, that private response then becomes available to any subsequent visitor who requests the same cache key, turning what should have been a single user’s personalized data into a leak affecting every visitor who happens to hit that cache entry afterward.
The reason this belongs in a diagnostic discussion rather than a purely security-focused one is that the initial symptom of both attacks is often indistinguishable from the accidental cross-user leakage described in the earlier case pattern: a user reports seeing content that should not be theirs. Establishing whether the cause is an innocent misconfiguration or active exploitation requires exactly the same cross-layer log investigation described throughout this article, plus one additional question that a purely operational investigation would not think to ask: was the specific header or cookie value involved something a legitimate user would plausibly send, or does it show signs of deliberate crafting — an unusual string, a script tag, a payload pattern recognizable from common attack tooling. Teams without security-aware members on the investigating team can and do miss this distinction, treating what was actually an active attack as a routine caching bug, fixing the immediate symptom, and leaving the underlying vulnerability — an unkeyed header reflected into a response — available for exploitation again.
Business impact on transactional platforms: e-commerce checkouts and SaaS logins
The abstract technical patterns described above translate into very concrete business consequences, and the specifics differ meaningfully depending on what kind of platform is affected, which is why treating “the site was slow for twenty minutes” as a single, uniform category of harm misses most of what actually matters to a business owner.
For e-commerce platforms, the checkout flow is the single highest-value few minutes of a customer’s entire visit, and it is also, structurally, the part of the site most likely to trigger exactly the database lock contention pattern described earlier, because checkout is where inventory decrements, payment authorizations, and order records all have to be written consistently, often to the same small set of hot database rows, under the highest concurrency the site ever experiences — during a sale, a product launch, or a seasonal peak. A cross-layer incident during this specific window does not merely inconvenience visitors; it directly prevents completed sales during the exact period the business planned around, and a meaningful share of the customers who hit a failed checkout during a promotion do not return later to try again, representing lost revenue that never shows up as a recorded transaction and is therefore easy for a business to underestimate after the fact, since there is no failed-order record to point to, only an unusually low conversion rate that requires deliberate analysis to notice at all.
For SaaS and B2B platforms, the equivalent high-stakes moment is often authentication rather than checkout — a login flow that touches session storage, a caching layer, and typically at least one database write to record the session or update a last-login timestamp. A caching misconfiguration that intermittently serves a stale or incorrect authenticated state can produce a specific and reputation-damaging symptom: users seeing another account’s data, or being logged in as the wrong user entirely, even briefly. Unlike a slow checkout, which frustrates but rarely alarms, this category of bug tends to trigger an immediate, urgent support escalation and, in regulated industries, a genuine question about whether a data protection incident needs to be reported, regardless of whether the underlying cause turns out to be a caching misconfiguration rather than an actual breach — the investigation and disclosure obligations are often triggered by the symptom itself, not by the eventual, more benign root cause.
Both categories of platform share a structural vulnerability: the parts of the application generating the highest business value are frequently also the parts most exposed to exactly the concurrency-driven and cache-key-sensitive failure modes this article has described, because high-value flows tend to be the ones under the most simultaneous load and the ones most likely to depend on genuinely personalized, non-cacheable state that a caching layer, configured without full awareness of that state, can easily mishandle. This is not a coincidence to be fixed once and forgotten; it is a permanent tension between performance optimization and correctness that has to be actively managed as the application evolves, not configured once at launch and left alone.
Business impact on content publishers and the agencies managing client infrastructure
Content publishers and media sites experience a different failure profile, one shaped by the fact that most of their traffic is anonymous, read-heavy, and — in principle — highly cacheable, which should make this category of site the easiest to protect from the incidents described throughout this article. In practice, publishers face a specific, sharp version of the same problem: traffic spikes that are unpredictable in timing but predictable in shape, driven by a story going viral, a link from a high-traffic external source, or a push notification reaching a large subscriber base simultaneously.
Because most of this traffic hits the same handful of URLs — the trending story, the homepage — the effective load on the database and php-fpm pool should, in a well-configured system, be minimal, since a well-tuned cache absorbs the overwhelming majority of requests at the CDN edge without ever reaching the origin. When that caching layer is misconfigured in one of the ways described earlier — a cookie set by an analytics or advertising script inadvertently included in the cache key, fragmenting what should have been one cache entry into thousands — a traffic spike that should have been trivially absorbed instead hits the origin at nearly full volume, and the origin, sized for ordinary day-to-day traffic rather than viral spikes, saturates within minutes. The site does not merely slow down under these conditions; it can become completely unreachable during precisely the window when traffic, and therefore advertising revenue and audience growth potential, is at its highest.
For agencies managing infrastructure across a portfolio of client sites — a category directly relevant to Slovak, Czech and other regional digital agencies operating in this space — the business impact compounds along a different axis entirely: the same class of incident recurring across multiple client stacks, each with a slightly different configuration, a different CDN provider, a different PHP framework’s assumptions about caching, and a different level of internal technical documentation. An agency team diagnosing a caching incident on one client’s WordPress and Cloudflare setup cannot assume the same root cause, or even the same diagnostic approach, will apply cleanly to a different client running a custom PHP application behind a different CDN, even though the surface-level symptom — “the site is slow” or “the site is showing wrong data” — looks identical in both support tickets.
This is precisely where the difference between an amateur, single-developer response and an experienced team’s response becomes commercially visible, not just technically correct. A team that has already built internal patterns for cross-layer diagnosis, has already turned on the necessary logging across client infrastructure by default, and has already seen several variants of the case patterns described earlier resolves an incident like this in under an hour. A team encountering this combination of symptoms for the first time, without the benefit of correlation IDs, synchronized clocks, or prior pattern recognition, can spend the better part of a working day chasing the wrong layer before arriving at the same conclusion — a gap in outcome that a client experiences directly as the difference between “our site had a brief blip” and “our site was down most of the afternoon and nobody could explain why.”
What this costs in measurable downtime, using published incident benchmarks
Quantifying the cost of the kind of incident described throughout this article is difficult in the general case, because the true cost depends heavily on business model, traffic pattern, and timing — a checkout outage during a flash sale costs far more per minute than the same outage on an ordinary weekday afternoon — but published industry benchmarks give a useful sense of scale, even for organizations well below enterprise size.
ITIC’s widely cited hourly downtime survey found that a substantial majority of mid-size and large enterprises now report that a single hour of downtime costs their organization more than three hundred thousand dollars, with a meaningful share of large enterprises reporting figures between one million and five million dollars per hour. These figures sit at the upper end of the scale and are not directly representative of the small and mid-size businesses that make up most of the client base for regional digital agencies, but the same research consistently finds a proportional relationship holding at smaller scale: organizations with a few million dollars in annual revenue and a handful of employees still measure meaningful downtime costs in the low thousands of dollars per hour once lost revenue and diverted staff time are both accounted for, and that figure climbs sharply for any business whose revenue is concentrated in short, high-traffic windows — precisely the e-commerce and media scenarios described in the two preceding sections.
Separately from direct revenue loss, incident cost research consistently identifies mean time to recovery, commonly abbreviated MTTR, as one of the strongest available levers for controlling total incident cost, and improvements in MTTR across the industry over recent years have been attributed largely to better monitoring, better instrumentation, and more disciplined incident response practice rather than to any change in how often incidents occur in the first place — a finding directly consistent with the argument made throughout this article, that most of the cost of an incident is determined less by the underlying technical fault, which is often unavoidable, than by how quickly a team can correctly diagnose it once it happens.
What an inexperienced fix attempt typically does versus what an experienced team does
| Response step | Inexperienced first attempt | Experienced team’s approach |
|---|---|---|
| Initial triage | Restart web server and hope it recurs | Check nginx, php-fpm and mariadb logs together for the exact window |
| Cause hypothesis | Commit to the first plausible explanation | Actively try to disconfirm each candidate before acting |
| Fix applied | Raise pm.max_children or server resources | Trace root cause across layers before changing any config |
| CDN involvement | Rarely checked unless caching is the obvious suspect | Checked first when any stale or inconsistent content is reported |
| Outcome | Symptom often recurs within days | Root cause addressed, recurrence rare |
The pattern the table summarizes is not a claim that inexperienced teams are careless; it reflects a genuine difference in available pattern recognition and instrumentation habits, built up specifically through prior exposure to incidents of this kind. Every hour spent on a resource increase that does not address the actual root cause is an hour during which the underlying condition remains present and can recur, often during the next high-traffic period, at which point the cost compounds rather than resets.
Regulatory and legal exposure: GDPR, log retention and evidentiary timestamps
Server logs sit in an uncomfortable regulatory position for operators serving European users: they are essential for the exact kind of diagnostic work described throughout this article, and they are, at the same time, a repository of personal data subject to the same obligations as any other personal data an organization holds. Nginx access logs record IP addresses on every line by default, and the Court of Justice of the European Union has confirmed that even a dynamic IP address qualifies as personal data under GDPR when an organization has a realistic means of linking it to an individual, which most operators of a web server do by definition, since the IP address arrives attached to every request their own infrastructure processes.
GDPR does not specify a fixed retention period for logs, which is often mistaken for permission to keep them indefinitely; in fact the opposite obligation applies under Article 5’s storage limitation principle, requiring that personal data be kept no longer than necessary for the purpose it was collected for, with the organization responsible for defining, documenting, and justifying its own retention period rather than defaulting to “as long as the disk has space.” In practice, organizations commonly settle on tiers reflecting different purposes: a relatively short window, often thirty to ninety days, for routine operational logs used for performance monitoring and everyday debugging, and a longer window, commonly six to eighteen months, for logs retained specifically for security monitoring or fraud investigation, where a legitimate-interest or legal-obligation basis can support the extended period — but whatever tiering a specific organization chooses, supervisory authorities treat the retention schedule itself as one of the first documents requested during any inspection, and “we never got around to deleting it” is explicitly not treated as a defensible position.
This creates a genuine and underappreciated tension with the diagnostic practices recommended throughout this article. Extended logging — longer retention, more verbose formats capturing additional headers and cookie-derived cache keys, correlation IDs that could in principle be linked back to a specific session or user — makes retroactive cross-layer diagnosis meaningfully easier, which is exactly the improvement most of this article has argued for, while simultaneously increasing the volume and sensitivity of personal data an organization is retaining and therefore accountable for. Resolving this tension well requires treating log design as a genuine compliance decision from the outset rather than a purely operational one: minimizing what is captured to what diagnosis actually requires, pseudonymizing identifiers where full values are not needed for correlation, and documenting a retention schedule that is short enough to satisfy the storage limitation principle while still covering a realistic window for investigating a slow-burning or intermittent incident of the kind described in the case patterns above, which can easily take days to even be recognized as a pattern rather than a one-off complaint.
A separate but related consideration is the evidentiary weight of log timestamps discussed earlier in the context of clock synchronization. When log data is used to support a disciplinary decision, respond to a contractual SLA dispute, or answer a regulatory inquiry, the reliability of the timestamps themselves becomes a live question, and “synchronized to an approved time source, with drift actively monitored” is the standard answer that satisfies frameworks such as ISO 27001’s clock synchronization control — an answer an organization can only give credibly if the underlying NTP discipline was actually in place before the incident occurred, not retrofitted afterward once a dispute has already begun.
Privacy and data handling inside logs during an active investigation
Beyond the retention-policy question addressed above, an active cross-layer investigation introduces its own, more immediate privacy risks, because the fastest path to a diagnosis often runs directly through the most sensitive data a log contains, and the pressure of an ongoing incident is exactly the wrong condition under which to be making careful decisions about data handling.
The php-fpm slow log, enabled with request_slowlog_timeout as described earlier, captures a full stack trace including function arguments in many configurations, which can mean session tokens, form input, or database query parameters containing personal data end up written to a log file that was enabled specifically to solve a performance problem, with no one having deliberately decided that this file should now be treated as a store of personal data requiring the same access controls and retention discipline as any other. The equivalent risk exists in mariadb’s slow query log when queries are logged with literal parameter values rather than parameterized placeholders — the mysqldumpslow -a flag and equivalent tooling specifically exist to reveal these literal values for debugging purposes, and doing so during an investigation can put emails, account identifiers, or payment-related fields directly into terminal scrollback, shared screen recordings, or a shared incident channel where a wider set of people than usual has access to it, often without anyone pausing to ask whether that access is appropriate.
The correct practice, and the one that distinguishes a disciplined incident response process from an ad hoc one, is to treat any log data pulled during an investigation with the same access controls as the production systems it came from, rather than treating it as informally shareable simply because it has been copied into a text file or a chat thread for convenience during a fast-moving incident. This means avoiding pasting raw log excerpts containing personal data into third-party tools, ticketing systems, or AI assistants without first considering whether those tools are an appropriate destination for that category of data, redacting obviously sensitive fields before wider sharing even when it costs a few extra minutes during a time-pressured incident, and treating any incident-specific export of log data as subject to the same retention and deletion obligations as the original logs, rather than allowing ad hoc copies to persist indefinitely in personal folders or old chat histories long after the incident itself has closed.
None of this is a reason to avoid the detailed logging this article has repeatedly recommended; the diagnostic value is real and the alternative — flying blind during an incident — is worse. It is, instead, an argument for building privacy-conscious habits directly into the incident response process itself: minimizing what gets copied out of the original log files in the first place, preferring aggregated or pattern-level evidence over raw literal values whenever the investigation does not specifically require the literal value, and being as deliberate about deleting incident-specific data exports once an investigation closes as about capturing them in the first place.
The tooling gap: why grep and manual log reading stop working past a certain scale
Every technique described so far in this article — reading an access log line, matching a timestamp, checking a slow log entry — works perfectly well by hand at small scale, and this is exactly why so many teams never invest in better tooling until scale forces the issue: the manual approach genuinely is sufficient for a site handling a modest amount of traffic, right up until it suddenly is not.
The breaking point is rarely a single dramatic threshold; it is a gradual erosion of feasibility as log volume grows. A site producing a few thousand access log lines a day can be searched with grep for a specific error string or IP address in well under a second, and a human can plausibly read the surrounding context by eye. The same site at ten or a hundred times the traffic produces log files that grep can still technically search, but where the output of that search — potentially thousands of matching lines spread across a multi-hour window — exceeds what a person can meaningfully read and mentally correlate against a second and third log source from a different system, especially under the time pressure of an active incident. Multi-file correlation compounds this problem multiplicatively rather than additively: cross-referencing one nginx log line against a corresponding php-fpm entry is a single manual lookup; doing this for hundreds of candidate requests across three separate log files, by hand, is not a task a human can complete reliably within a useful timeframe, regardless of how methodical they are.
Log rotation adds a further practical obstacle that catches out teams investigating an incident that was only reported some days after it occurred. Default log rotation policies on many distributions compress and eventually delete logs after a matter of days to a couple of weeks specifically to control disk usage, which means an investigation that begins a week after the fact can find that the exact log data needed has already been rotated into a compressed archive that requires extra steps to search, or in less well-configured environments, has already been deleted entirely, leaving no data at all for the window in question — a gap that no amount of diagnostic skill can compensate for, since the underlying evidence simply no longer exists.
This is the point at which purpose-built log aggregation and search tooling stops being a nice-to-have and becomes a genuine operational necessity, not because manual reading is a poor skill to have, but because it does not scale to the volume and cross-referencing burden that a real incident on a meaningfully trafficked site actually presents. A team that has already centralized its logs into a searchable system before an incident happens can run a single structured query spanning all relevant sources and the full time window in seconds; a team without that infrastructure has to reconstruct, by hand, under time pressure, exactly the kind of cross-system correlation that a properly configured aggregation platform would have made close to instantaneous — and the difference in outcome between these two starting positions is frequently the difference between resolving an incident within the hour and still investigating it the following day.
Observability platforms, log aggregation and what they solve and do not solve
The tooling ecosystem that has grown up around exactly the diagnostic problems described in this article is mature and genuinely capable, spanning self-hosted options like the Elastic Stack and Grafana Loki through to commercial observability platforms that combine log aggregation, metrics, and distributed tracing into a single searchable interface. Understanding what these platforms actually solve, and what they leave unsolved, matters for setting realistic expectations about how much of the difficulty described throughout this article a tooling investment removes.
What these platforms solve well is the scale and cross-referencing problem described in the previous section directly: logs from nginx, php-fpm, mariadb, and where the provider supports it, CDN logs, can be shipped into a single centralized store, indexed for fast search, and queried with structured filters rather than line-by-line manual reading. Where a shared correlation ID has been implemented as described earlier, these platforms make it possible to pull every log line associated with a specific request across every system in a single query, collapsing what used to be a manual, error-prone, multi-terminal exercise into a single search bar interaction that takes seconds rather than hours. Modern platforms built around OpenTelemetry additionally visualize distributed traces as a connected timeline, showing exactly how long each hop of a request took relative to the others, which directly addresses the timestamp-ordering ambiguity discussed in the section on clock drift, since the trace’s internal timing is generated consistently by the instrumentation itself rather than being reconstructed after the fact from independently-clocked log sources.
What these platforms do not solve, and this is the point most vendor marketing understandably glosses over, is the judgment required to correctly interpret what the aggregated data shows. A platform can present the exact php-fpm slow log entry and the exact corresponding mariadb query in a single unified view within seconds of an incident occurring; it cannot, on its own, know that the query’s slowness was caused by a lock held by a different, unrelated transaction rather than by the query’s own execution plan, a distinction that still requires the same kind of domain knowledge described in the earlier case pattern about database locks. Observability tooling accelerates the mechanical part of an investigation — finding and assembling the relevant evidence — dramatically, but it does not replace the interpretive step of understanding what that evidence actually means, and a team that has invested heavily in tooling while lacking the underlying expertise to interpret its output correctly can end up reaching a wrong conclusion faster and with more apparent confidence than a team working from raw logs, which is arguably a worse outcome than being slow.
The realistic framing, and the one this article argues for throughout, is that tooling and expertise are complements rather than substitutes. Good tooling turns a six-hour manual correlation exercise into a five-minute query, but it takes an experienced team to know which query to run, which candidate explanations to actively rule out before accepting one, and which of several equally plausible-looking causes actually explains the specific evidence in front of them — the judgment calls this entire article has been describing do not disappear once better tooling is in place; they simply get applied faster, against better-organized data.
What an experienced team actually does differently, step by step
Everything covered so far describes individual mechanisms and failure patterns; it is worth stepping back and describing, concretely, the sequence an experienced team actually follows when a cross-layer incident is reported, because the difference from a less experienced approach is less about knowing more individual facts and more about the discipline of the process itself.
The first step, before touching any specific log, is establishing a precise time window and confirming it against more than one source — not trusting a single user’s memory of “sometime this afternoon” but cross-checking against monitoring alerts, error-tracking dashboards, or support ticket timestamps, because starting an investigation with a wrong or overly broad time window is one of the most common ways to waste the first hour of effort on log volume that is simply irrelevant to the actual incident. Once a credible window is established, the second step is confirming, layer by layer, starting from the outermost edge, that a request actually reached each system in the stack during that window — checking the CDN’s own analytics or cache-status logs first, then nginx’s access log, then php-fpm, then mariadb — rather than assuming every layer was involved and immediately diving into the most familiar log file, since confirming where a request stopped or diverged from the expected path is frequently more informative than any individual error message.
The third step is generating multiple candidate hypotheses explicitly, in writing where the incident is significant enough to warrant a shared document, rather than committing mentally to the first plausible-looking explanation — the earlier section on why a single symptom can have multiple causes exists precisely because skipping this step is the single most common source of misdiagnosis in this stack. Each candidate is then actively tested against the available evidence, specifically looking for evidence that would rule it out rather than only evidence that supports it, since a hypothesis nobody tried to disprove is a weak basis for a fix regardless of how intuitively plausible it seemed at the outset.
Once a root cause is identified with reasonable confidence, an experienced team’s next step is distinguishing between an immediate mitigation and a root-cause fix, and treating these as two separate, sequenced actions rather than conflating them. Restarting a saturated php-fpm pool, temporarily purging a poisoned cache entry, or manually rolling back a bad deployment are legitimate immediate mitigations that restore service quickly, but they are explicitly not treated as the resolution of the incident until the underlying cause — a lock contention pattern, a missing Vary header, an unmonitored NTP drift — has been separately identified and addressed, because skipping this distinction is exactly how the same incident recurs weeks later under the same conditions, at which point the team is back to square one having gained nothing from the first occurrence except a faster mitigation, not a genuine fix.
The final step, frequently the one most often skipped under time and resource pressure, is a written post-incident review capturing not just what happened but what diagnostic signal was missing or too slow to access during the investigation — the log that was not being captured, the correlation ID that did not exist, the CDN plan tier that lacked the necessary logging access — and converting that gap into a concrete, scheduled piece of instrumentation work rather than a note that gets filed away and never revisited. This last step is what compounds an experienced team’s advantage over time: each incident that is properly closed out this way makes the next similar incident measurably faster to diagnose, while a team that skips this step re-derives the same lessons from scratch every time a similar failure recurs.
Practical steps a smaller team can take before an incident happens
Not every organization running this stack has the resources to build a dedicated observability platform or hire specialists in cross-layer diagnosis, and the good news, relative to how difficult the retroactive investigation techniques described throughout this article actually are, is that most of the highest-value preparatory work is inexpensive and does not require enterprise-scale tooling to implement.
The single highest-leverage change, repeated throughout this article because the evidence for its value is so consistent, is generating and propagating a request correlation identifier through nginx’s $request_id, forwarding it as a header to php-fpm, and including it in the application’s own logging output. This one change converts every future cross-layer investigation from approximate timestamp matching into an exact string search, and it requires no new infrastructure — only a configuration change in nginx and a small addition to the application’s existing logging calls.
The second is enabling the diagnostic logging that ships disabled by default across every layer of this stack: extending the nginx log format to include upstream response time and cache status, turning on php-fpm’s slow log with a threshold calibrated against the application’s normal latency distribution rather than an arbitrary default, and enabling mariadb’s slow query log alongside Performance Schema’s digest summary tables. None of these settings meaningfully degrades performance at typical production traffic levels, and all of them are the difference between having evidence available when an incident occurs and discovering, mid-investigation, that the exact signal needed was never being recorded.
The third is establishing basic clock discipline across every server in the stack — a properly configured NTP or Chrony client synchronized against a reliable time source, with drift monitored rather than assumed, closing off the entire class of false-causality problems described in the section on clock synchronization, at essentially zero ongoing cost once configured.
The fourth, specific to any deployment sitting behind a CDN, is auditing the cache configuration deliberately rather than accepting whatever defaults were in place when the CDN was first connected: confirming exactly which cookies and headers are included in the cache key, confirming that this list is actually correct against what the application currently sets — not what it set when the configuration was last reviewed, since new cookies from marketing tags or third-party scripts are added to production sites constantly without anyone revisiting cache configuration — and securing whatever level of CDN-side logging access the current plan tier allows, upgrading it if the plan in place does not expose per-request cache status detail.
None of these four changes requires specialist expertise to implement, and all four can typically be completed within a single working day by a competent developer with access to the relevant systems. What they collectively buy is not immunity from the incidents described throughout this article — cross-layer failures of this kind will still happen on a sufficiently complex, sufficiently high-traffic stack no matter how well it is instrumented — but a dramatic reduction in how long the next one takes to correctly diagnose, converting what might otherwise be a multi-day investigation into something closer to the hour-scale resolution an experienced team achieves even without this preparation, because the preparation closes exactly the evidentiary gaps that force experienced teams to fall back on slower, more inferential techniques in the first place.
When to escalate to specialists and what that conversation should include
Even with all of the preparatory work described in the previous section in place, there is a real and identifiable point at which an internal team, however competent, should escalate a cross-layer incident to specialists rather than continuing to investigate alone, and recognizing that point early saves both time and money relative to continuing to invest internal effort in an investigation that has stalled.
The clearest signal is duration relative to complexity: if an incident has been under active investigation for more than a few hours without a clearly identified root cause, and the symptom involves more than one layer of the stack — a caching issue that also seems to correlate with database load, for instance, or an intermittent failure that has already been shown not to reproduce under direct observation, as described in the earlier case pattern — this is precisely the profile of incident that benefits most from experience the internal team may simply not yet have accumulated, since much of what separates a fast diagnosis from a slow one is prior exposure to the specific pattern rather than raw technical skill. A second clear signal is recurrence: an incident that has been “fixed” more than once through the same category of mitigation — repeated pool size increases, repeated cache purges, repeated server restarts — without the underlying frequency actually decreasing is strong evidence that the mitigations have been addressing a symptom rather than the root cause, exactly the distinction the previous section described as critical to get right.
When escalating, the single most valuable thing an internal team can hand over is not a conclusion but a well-organized timeline of evidence: the confirmed time window, the specific log excerpts already gathered from each layer for that window with sensitive fields already handled according to the privacy practices described earlier, a list of hypotheses already considered and specifically why each was ruled out, and — critically — a clear statement of which diagnostic signals were and were not available, since a specialist walking into an investigation needs to know immediately whether the correlation ID, synchronized clocks, and extended logging described in the preparatory section actually exist for this specific deployment, or whether the investigation will have to proceed with the more inferential, timestamp-and-IP-based techniques that make everything slower and more uncertain.
A specialist engagement that starts from a well-organized handover of this kind routinely resolves in a fraction of the time an internal team spent reaching the point of escalation, not because the specialist is simply faster at reading the same logs, but because pattern recognition built from having diagnosed dozens of structurally similar incidents across different clients and stacks lets them recognize a case pattern within minutes that took the internal team hours to even properly characterize. This is also, from a purely commercial standpoint, the argument for engaging specialists proactively — through an audit of logging, caching, and clock configuration before any incident occurs — rather than only reactively during a live outage, since the preparatory audit is both cheaper and calmer than emergency diagnosis, and it directly produces the four categories of instrumentation described in the previous section as its concrete output.
The staffing reality behind why this expertise is scarce and expensive
The kind of expertise described throughout this article — the ability to correctly read four semi-independent logging systems together, recognize recurring case patterns, and know when a plausible explanation is actually correct versus merely consistent with the evidence — is not a certification that can be obtained through a single course, and this is a significant part of why it commands a premium and remains genuinely scarce relative to demand.
Much of this skill is built specifically through direct exposure to incidents of exactly this kind, repeated across enough different client stacks and enough different specific failure modes that the underlying patterns — a 502 that is really a database lock, a stale cache that only affects logged-in users, a slow log entry pointing to the wrong culprit — become recognizable quickly rather than requiring re-derivation from first principles under time pressure. This is fundamentally different from expertise that can be acquired primarily through documentation and structured study, such as learning a new programming language’s syntax; cross-layer incident diagnosis depends heavily on tacit knowledge accumulated through direct experience with false leads and confirmed root causes, which is exactly the kind of knowledge that resists being fully captured in a runbook or a certification curriculum, however well-written either might be.
This creates a structural staffing problem for smaller organizations and agencies specifically. A single generalist developer, however capable at building features, may never encounter enough of these specific incident patterns in the normal course of their work to build this kind of pattern recognition, particularly if the organization’s infrastructure is well enough managed that serious incidents are genuinely rare — which is, ironically, itself an outcome of good infrastructure practice that simultaneously reduces the opportunity to build incident-response expertise internally. Organizations that do build this expertise internally typically do so either by running infrastructure at a scale where incidents, while individually rare per client, occur frequently enough in aggregate across a large portfolio to provide continuous learning opportunities, or by deliberately hiring people who already accumulated this experience elsewhere, which explains why specialists with a demonstrated track record across multiple client engagements command noticeably higher rates than general-purpose web development work, reflecting genuine scarcity rather than an arbitrary market premium.
For a smaller organization, the realistic and cost-effective path is rarely to build this specific expertise fully in-house, since doing so requires either years of accumulated incidents or a deliberate, expensive hiring decision that is hard to justify against a base rate of infrequent incidents. The more common and more economically sound pattern, and one increasingly common among agencies serving multiple clients across the same regional market, is maintaining the preparatory instrumentation described earlier as standard practice across every managed deployment — which any competent generalist team can implement and maintain — while keeping a working relationship with genuine cross-layer diagnosis specialists for the specific incidents that exceed what internal pattern recognition can resolve quickly, treating specialist engagement as a targeted, occasional cost rather than a permanent headcount commitment that would be difficult to keep fully utilized given how infrequently any single well-managed stack actually produces incidents of this severity.
Strategic outlook: what is changing as AI-assisted log analysis tools mature
The diagnostic techniques described throughout this article have historically depended on human pattern recognition applied to raw or lightly aggregated log data, but the tooling landscape is shifting in a direction that is directly relevant to the specific difficulty this article has described: correlating evidence across systems that were never designed to be read together.
AI-assisted root-cause analysis tools, several of which appeared directly among the sources referenced throughout this article’s research, are increasingly marketed specifically around this cross-system correlation problem — ingesting logs, traces, and metrics from multiple layers simultaneously and surfacing candidate root causes automatically, rather than requiring a human to manually formulate and test each hypothesis in sequence as described in the step-by-step process outlined earlier. The genuine value these tools offer is speed at exactly the mechanical part of the process that scales poorly for humans: searching enormous log volumes for a specific pattern, correlating timestamps across differently-clocked systems with statistical rather than exact matching, and surfacing candidate anomalies a human might not have thought to look for because they were not among the hypotheses initially considered.
What these tools have not yet demonstrated, at least based on the current state of the technology, is a reliable substitute for the specific kind of tacit, experience-built judgment described in the section on staffing scarcity — the ability to recognize, for instance, that a slow log entry pointing at a database call is very likely the symptom rather than the cause, a distinction that depends on understanding the underlying mechanics of lock contention rather than any statistical pattern immediately visible in the log data itself. This limitation is not a permanent ceiling; it reflects where the current generation of tooling sits, and organizations building on top of large language models are actively working on exactly this kind of causal reasoning applied to operational data, which is a meaningfully different and harder problem than pattern matching or anomaly detection on its own.
The realistic expectation for the near term is that these tools will continue to compress the mechanical, search-and-correlate portion of an investigation dramatically, further widening the gap in outcome between organizations that have the underlying instrumentation in place — correlation IDs, synchronized clocks, extended logging — for these tools to work against, and organizations that do not, since even the most capable AI-assisted analysis tool cannot correlate a signal that was never captured in the first place. This means the practical advice given earlier in this article — enable the logging, synchronize the clocks, propagate the correlation identifiers — becomes, if anything, more rather than less important as better analysis tooling becomes available, because that instrumentation is the raw material the tooling depends on, and no amount of downstream analytical sophistication substitutes for evidence that was simply never recorded.
Open questions the evidence cannot yet settle
Several genuinely open questions remain about how this diagnostic problem will evolve, and it is worth stating them plainly rather than presenting more certainty than the current evidence supports.
It is not yet clear how far AI-assisted root-cause analysis tools can go in replicating the specific kind of causal reasoning described throughout this article — distinguishing a symptom from a cause across systems with no shared instrumentation — versus how much of their apparent effectiveness in current marketing and case studies depends specifically on organizations that had already implemented the underlying instrumentation described in the preparatory section, which would mean the tooling is amplifying good existing practice rather than compensating for its absence. Untangling this properly would require controlled comparison across organizations with meaningfully different baseline instrumentation, data that is not currently available in published, methodologically rigorous form.
It is similarly unclear how CDN providers will evolve their default logging and cache-key transparency over the coming years. The trend among several providers toward more granular, real-time logging access, including automatic Vary and cache-status headers by default in some newer caching libraries and platforms, suggests movement toward reducing the specific “invisible fourth server” problem described early in this article, but this movement is uneven across the industry, and lower-cost or lower-tier CDN plans may continue to withhold exactly the detailed logging access that makes the difference between a fast and a slow investigation, meaning the underlying difficulty this article describes may persist for a meaningful share of smaller deployments even as it eases for larger, more heavily invested organizations.
There is also a genuine open question about whether the industry-wide trend toward serverless and edge-compute architectures, which restructure where PHP-equivalent execution actually happens relative to the database and the CDN, will make this specific category of cross-layer diagnosis easier or harder over time. Some aspects plausibly improve — many serverless platforms include distributed tracing as a default rather than an opt-in feature, directly addressing the correlation-ID gap described earlier — while other aspects may introduce new versions of the same underlying problem in unfamiliar form, since a request now potentially traverses even more distinct, independently-operated systems than the four described throughout this article, each with its own partial visibility into the whole.
None of these open questions change the practical guidance given throughout this piece for a team currently running nginx, php-fpm and mariadb behind a CDN today: instrument now, synchronize clocks now, and build the internal or external expertise to read the results correctly, because whatever the tooling landscape looks like in a few years, the fundamental difficulty this article describes — that four independently-designed systems producing four independent, partial views of the same event are hard to reconstruct into one coherent story after the fact — is a structural property of the architecture itself, not a temporary gap that better software alone will fully close.
Comparing self-hosted log aggregation against managed observability platforms
Teams that decide to invest in centralized log aggregation, as recommended in the section on tooling gaps, face a genuine choice between self-hosted options and managed commercial platforms, and the right answer depends heavily on team size, existing operational maturity, and how much of the underlying infrastructure work the organization wants to own directly.
Self-hosted stacks built on the Elastic Stack, Grafana Loki paired with Grafana for visualization, or similar open-source combinations offer full control over data residency — a genuinely important consideration given the GDPR discussion earlier in this article, since keeping log data within the EU avoids the cross-border transfer questions that arise when shipping logs to a US-based managed service — and avoid the recurring per-gigabyte ingestion costs that commercial platforms typically charge, which can become substantial for a busy site generating detailed access logs at high verbosity. The tradeoff is that self-hosting shifts the operational burden of running, scaling, and securing the aggregation system itself onto the same team that is already responsible for the application stack, and a poorly maintained self-hosted logging system — one that silently drops data during a traffic spike, or runs out of disk space precisely during the highest-volume period of an incident — can fail at exactly the moment it is needed most, which is a real and recurring failure mode reported by teams who adopted self-hosted aggregation without budgeting ongoing maintenance time for it.
Managed commercial observability platforms remove that operational burden and typically offer more polished correlation and tracing features out of the box, including automatic instrumentation libraries that reduce the manual work of adding correlation IDs described earlier in this article, but introduce recurring costs that scale with data volume and can become a meaningful line item for a high-traffic site, along with the data residency and cross-border transfer considerations already noted, which matter specifically for organizations serving EU users under GDPR.
For most small to mid-size teams running the stack described throughout this article, a reasonable middle path is a lightweight self-hosted solution for routine log aggregation and search — sufficient to solve the scale problem described earlier without requiring a dedicated platform team to maintain it — paired selectively with a managed distributed tracing service specifically for the correlation-ID and cross-service timing visibility that self-hosted log search alone does not provide as elegantly. The specific choice matters less than the underlying principle already established: whichever approach is chosen, it needs to actually be implemented and properly maintained before an incident happens, since a logging platform that exists on paper but has never been tested under load, or that nobody has verified is actually capturing the fields needed for the correlation techniques described earlier, provides false confidence rather than genuine readiness.
A practical checklist for the first thirty minutes of a cross-layer incident
Everything described in the step-by-step process outlined earlier benefits from being reduced, for the specific moment an incident is first reported, into a short and immediately actionable sequence, since the first thirty minutes of an investigation set the trajectory for everything that follows, and a poor start — an overly broad time window, an unchecked assumption about which layer was involved — tends to compound rather than self-correct as the investigation proceeds.
The first action is establishing the time window from at least two independent sources rather than one, as discussed earlier, since a user’s memory of when a problem occurred is frequently imprecise by ten or twenty minutes in either direction, enough to meaningfully change which log entries fall inside or outside the search. The second action is a quick, layer-by-layer confirmation of where the request actually reached, starting from the CDN if one is present: checking cache-status headers or CDN analytics first, then nginx access and error logs for the window, then php-fpm’s error and slow logs, then mariadb’s error log and slow query log or Performance Schema summary — not because every layer needs a deep read at this stage, but because a quick pass across all four immediately reveals which layers show any activity at all during the window, narrowing the investigation before any detailed reading begins.
The third action, once a plausible layer or two has been identified, is explicitly writing down the leading hypothesis and one or two genuine alternatives, resisting the pull toward committing fully to the first explanation that fits, precisely because of the multiple-plausible-causes problem discussed earlier in this article. The fourth action is checking, specifically, whether the symptom matches any of the recurring case patterns described earlier — a 502 during high concurrency that might indicate lock contention, a stale-content report affecting only a subset of logged-in users that points toward a cache-key issue, an intermittent failure that has already resisted live reproduction — since recognizing a known pattern early can save the time that would otherwise be spent re-deriving the same diagnostic path from scratch.
The fifth and final action within this initial window, easy to skip under time pressure but consistently valuable, is a brief written note capturing what has been checked and ruled out so far, even if the investigation is not yet resolved, because this note becomes exactly the handover material described earlier if the incident needs to be escalated to specialists, and it prevents the common and genuinely wasteful pattern of a second engineer joining the investigation later and re-checking ground the first engineer already covered, simply because nothing was written down to indicate it had already been ruled out.
How incident communication with clients and stakeholders should be handled during diagnosis
Everything described so far in this article addresses the technical side of diagnosis, but for agencies and internal teams alike, how an incident is communicated to the business stakeholders or clients affected by it is a genuinely separate discipline, and getting it wrong can damage a client relationship even when the underlying technical diagnosis is handled competently and quickly.
The specific difficulty this article has described — that a cross-layer incident frequently takes real time to properly diagnose, and that premature conclusions are actively worse than an honest “still investigating” — creates a direct tension with a client or stakeholder’s natural desire for an immediate, confident explanation. Committing early to an unverified root cause purely to satisfy that desire for certainty, and then having to walk it back once the actual cause emerges, damages credibility far more than a calibrated, honestly uncertain update delivered on a predictable cadence. The discipline that experienced teams apply here mirrors the discipline described earlier for the technical investigation itself: state clearly what is known, what is still being verified, and roughly when the next update will come, rather than presenting a hypothesis as a conclusion before it has actually been tested against disconfirming evidence.
A second communication discipline worth naming explicitly is distinguishing, in any update to a client, between the immediate mitigation that restored service and the root-cause fix that prevents recurrence, exactly the distinction described earlier in the section on what experienced teams do differently. A client told simply “the site is back up” after a mitigation, without any indication that root-cause work is still ongoing, reasonably assumes the incident is fully closed, and can be legitimately upset if the same symptom recurs days later, an outcome that is avoided entirely by being explicit, in the very first post-incident communication, about which category of fix has actually been applied so far.
A third and final point specific to agencies managing multiple client relationships is that the case patterns and instrumentation gaps described throughout this article tend to recur across a portfolio of similar client stacks, and communicating that pattern proactively — noting to a client, after resolving one incident, that the same underlying instrumentation gap likely exists across their other properties or that a similar client recently experienced a related issue — turns a single incident response into a demonstrable, ongoing value proposition rather than a one-off firefighting exercise, which is precisely the kind of communication that differentiates a agency operating with genuine cross-layer expertise from one that is simply reacting to each incident in isolation without connecting it to the broader pattern this article has described throughout.
Comparison with alternative architectures: managed PaaS and serverless PHP hosting
A fair comparison worth making explicitly is how the diagnostic difficulty described throughout this article changes, for better or worse, on architectures that deliberately abstract away some or all of the individual layers discussed — managed PHP platform-as-a-service offerings, or serverless execution models where PHP code runs in short-lived functions rather than long-running php-fpm workers.
Managed platforms that bundle the web server, PHP execution, and often a managed database into a single vendor-operated product genuinely simplify some of the specific problems described earlier: the vendor typically handles clock synchronization across their own infrastructure as a baseline operational responsibility rather than something the client has to configure, and many such platforms provide built-in request tracing or a unified log view spanning what would otherwise be three separate systems, directly addressing the correlation-ID gap that this article has repeatedly identified as the single highest-leverage fix. This genuinely reduces the specific difficulty this article describes for the layers the platform actually manages.
What these platforms typically do not remove is the CDN and cookie-related caching difficulty, since most such platforms still sit behind a CDN — either the vendor’s own or a separate third-party one the client layers on top — and the Vary-header, cache-key, and cookie-fragmentation issues described at length earlier in this article apply identically regardless of what manages the origin’s web server and database underneath. In some cases, a managed platform’s more opinionated, less directly configurable caching layer can make these issues harder rather than easier to diagnose, precisely because the client has less direct visibility into or control over the exact cache-key logic the vendor applies, trading direct diagnostic access for operational simplicity.
Serverless execution models, meanwhile, introduce their own version of the concurrency problem discussed in the database-lock case pattern: because functions scale by spinning up new, isolated instances rather than sharing a fixed pool of long-running workers as php-fpm does, the specific worker-exhaustion failure mode described earlier is less likely to occur in the same form, but this comes at the cost of a different diagnostic challenge, since each function invocation may run on entirely different underlying infrastructure with its own clock and its own partial view of the request, potentially fragmenting the diagnostic picture across even more independent execution contexts than the four-layer model this article has focused on.
The honest conclusion is that no widely deployed architecture available today fully eliminates the cross-layer diagnostic difficulty described throughout this article; different architectures simply relocate which specific layers are hard to correlate and which vendor, rather than the client’s own team, is now responsible for solving it. This makes the underlying discipline described throughout this piece — insisting on correlation identifiers, verifying what logging access is actually available before an incident occurs, and understanding the specific caching behaviour of whatever CDN sits in front of the origin regardless of what runs behind it — relevant across nearly every architectural choice a team might make, not specific to the traditional nginx, php-fpm, mariadb combination this article has used as its primary example.
Risks and limits of over-relying on any single diagnostic technique
Every technique described throughout this article — correlation IDs, extended logging, distributed tracing, disconfirming candidate hypotheses before accepting one — is genuinely valuable, and it is worth closing the technical portion of this article with an honest account of where each of these techniques has real limits, since presenting any single method as a complete solution would misrepresent how this work actually goes in practice.
Correlation IDs solve the join problem cleanly, but only for the systems that were actually instrumented to propagate and log them, and a stack that has added this instrumentation to nginx and the PHP application but never extended it into query comments read by mariadb, or into the CDN’s own logging where the provider does not support custom header pass-through into their log format, still leaves exactly the kind of gap this article has spent considerable space describing, just at a different layer than before. Extended logging genuinely surfaces more evidence, but every additional field logged is also additional data volume, additional storage cost, and, as the privacy section discussed, additional sensitive data that has to be handled carefully, meaning the right level of verbosity is a genuine tradeoff rather than a setting where more is unconditionally better.
Distributed tracing and observability platforms compress the mechanical search-and-correlate work dramatically, as discussed earlier, but remain only as good as the instrumentation coverage behind them, and a trace with a large unexplained gap between two spans — common when a request touches a system the tracing library does not instrument, such as a legacy component or an external third-party API — can look complete and authoritative while actually hiding exactly the missing evidence an investigator most needs, a failure mode that is arguably more dangerous than an obviously incomplete manual log search, because a polished visualization inspires more confidence than its actual evidentiary completeness warrants.
Even the discipline of actively seeking disconfirming evidence before committing to a hypothesis, described as central to how experienced teams operate, has a practical limit under real incident time pressure: an investigation cannot rule out every conceivable alternative explanation before acting, and a team has to exercise judgment about when the available disconfirming evidence is sufficient to proceed with a fix, even knowing that judgment call itself can occasionally be wrong. The realistic takeaway is that every technique in this article reduces uncertainty rather than eliminating it, and treating any single one of them — a correlation ID, a tracing dashboard, a disconfirmation checklist — as a guarantee of correctness is itself a subtle version of the same overconfidence trap this article has warned against throughout: mistaking a plausible, well-supported conclusion for a certain one. The actual practice of cross-layer incident diagnosis, done well, retains a degree of epistemic humility even after a fix has been applied, continuing to monitor for recurrence rather than treating the case as definitively closed the moment service is restored.
How incident frequency and severity should shape investment priorities
Given everything described throughout this article, a reasonable final question is how a team should actually prioritize among the many recommendations made here, since implementing all of them simultaneously is rarely realistic against competing engineering demands, and treating every recommendation as equally urgent is itself a poor use of limited time.
The most defensible prioritization framework ties investment directly to the product of incident frequency and severity specific to a given deployment, rather than applying a generic checklist uniformly regardless of context. A high-traffic e-commerce platform running frequent promotional sales sits squarely in the highest-priority quadrant described throughout this article — the checkout-flow lock contention pattern, the database Performance Schema visibility, and the CDN cache-key audit are not optional hardening for a business whose revenue concentrates so heavily into short, high-concurrency windows, and the cost of the one-day implementation effort described earlier is trivial relative to even a single poorly diagnosed incident during a major sale. A low-traffic informational site with no user accounts and no dynamic checkout flow, by contrast, faces meaningfully lower stakes from most of the caching and concurrency failure modes described in this article, and a proportionate response there might reasonably stop at basic clock synchronization and extended nginx logging, deferring the more involved correlation-ID and Performance Schema work until traffic or complexity genuinely warrants it.
Severity, independent of frequency, also deserves separate weight in this prioritization. An incident type that occurs rarely but carries outsized consequence when it does — the cross-user data leakage pattern described earlier, for instance, which triggers not just a technical fix but potentially a regulatory disclosure obligation regardless of how rare the underlying caching bug actually is — justifies preparatory investment disproportionate to its statistical frequency, precisely because the tail-risk cost of getting it wrong once is high enough to outweigh many years of the bug never occurring at all.
The practical guidance this suggests is straightforward to state even though applying it requires genuine judgment specific to each deployment: rank the case patterns and preparatory measures described throughout this article against the actual traffic pattern, revenue concentration, and regulatory exposure of the specific platform in question, rather than treating this article’s recommendations as a uniform checklist to be completed in the order presented. A team operating with limited engineering time should reasonably implement the correlation-ID and clock-synchronization work first, given how cheaply both are achieved and how broadly they benefit every other diagnostic technique described in this piece, and then layer additional instrumentation — extended logging thresholds, CDN cache-key audits, Performance Schema monitoring — in proportion to where their specific platform’s traffic and business model concentrate the greatest exposure to the failure patterns this article has described in detail.
The role of synthetic monitoring in catching what logs alone miss
One category of tooling deserves separate mention because it addresses a blind spot none of the logging techniques described so far actually cover: synthetic monitoring, meaning automated requests sent on a schedule from external locations to check that a site behaves correctly, independent of whether any real user happens to be visiting at that moment.
Every log source discussed in this article — nginx, php-fpm, mariadb, CDN analytics — is fundamentally reactive: it records what happened to requests that actually occurred, which means a failure window with unusually low organic traffic can go entirely unrecorded in any of these logs simply because too few real users happened to hit the affected code path during that specific window to leave a meaningful trace. Synthetic monitoring closes this gap by generating its own steady, predictable stream of requests regardless of organic traffic levels, which is specifically valuable for catching exactly the kind of narrow, low-frequency incident described in the earlier case pattern about failures that vanish under direct observation, since a synthetic check running every minute from multiple geographic locations will register a failure during a brief degraded window even if the affected real user traffic during that same window happened to be minimal.
Synthetic checks are also the most reliable way to detect the CDN-specific failure modes described at length earlier in this article, because a synthetic monitor configured to check response headers directly — confirming cache status, confirming the expected content is actually being served rather than a stale cached variant — provides exactly the CDN-side visibility that origin logs structurally cannot, without requiring the deeper, often paid-tier CDN logging access discussed earlier. A small number of well-designed synthetic checks, covering the specific high-value flows identified in the business-impact sections of this article — checkout completion, login, the specific pages most likely to be affected by a cache-key misconfiguration — closes a meaningful share of the detection gap this article has otherwise attributed to gaps in logging, and does so at comparatively low implementation cost relative to the deeper instrumentation work described elsewhere in this piece, making it a reasonable and often underused addition to the preparatory checklist regardless of which other recommendations in this article a given team chooses to prioritize first.
Common questions about diagnosing nginx, php-fpm and mariadb incidents
A 502 means nginx could not connect to php-fpm at all, which can happen because the socket is missing, the backlog queue is full, or the master process is down. In these cases php-fpm never accepted the request, so there is nothing for it to log.
A 502 means the connection to php-fpm failed outright. A 504 means the connection succeeded and a worker accepted the request, but no response arrived before nginx’s configured timeout elapsed, pointing toward a slow operation inside the request rather than a connectivity problem.
If the underlying cause is database lock contention rather than insufficient worker capacity, adding more workers only allows more processes to queue behind the same lock, consuming additional memory and sometimes triggering an out-of-memory condition that introduces a new failure on top of the original one.
Yes. If the CDN serves a request entirely from edge cache, or blocks it before it reaches the origin, the origin’s access and error logs will show nothing at all for that request, because the origin never received it.
This typically happens when a cache key does not account for a cookie or header that actually affects the content, so the first cached response for a given cache key is served to every subsequent visitor sharing that key until the entry expires or is purged.
It resolves the immediate symptom by forcing new content to be cached, but it does not fix the underlying cache-key misconfiguration, so the same stale-content pattern can recur the next time the relevant content changes.
Cookies frequently carry per-visitor or per-session values that most caching systems intentionally exclude from the cache key to avoid fragmenting the cache per user, but if the excluded cookie actually affects the content shown, that exclusion becomes the source of incorrect or leaked content.
It records a stack trace showing where the PHP interpreter was executing when a request exceeded the configured timeout, but it does not by itself explain why that point in the code was slow, which usually requires cross-referencing against the database logs for the same window.
The query itself may not have changed at all. It is common for the query to be queued behind a lock held by an unrelated transaction, or waiting on an exhausted connection pool, with the wait time being what actually exceeded the slow log threshold rather than the query’s own execution time.
Servers can be configured in different timezones, or can suffer gradual clock drift even when nominally synchronized to NTP, since NTP corrects small offsets gradually rather than instantly. Both effects can make one server’s logs appear to describe events happening before their actual cause on another server.
A correlation ID is a unique value generated once at the start of a request and passed through every system that touches it, so every log line related to that request can be found with an exact search rather than an approximate timestamp match across differently-clocked systems.
The underlying mechanism is often identical — an unkeyed header or cookie reflected into a cached response — but poisoning specifically involves an attacker deliberately crafting that input, whereas an ordinary misconfiguration produces the same symptom accidentally through normal traffic.
Yes. The Court of Justice of the European Union has confirmed that even a dynamic IP address is personal data when an organization has a realistic means of linking it to an individual, which applies to standard nginx access logs by default.
GDPR does not set a fixed period; organizations must define, document, and justify a retention period based on purpose, commonly ranging from a few weeks for routine operational logs to several months to around a year and a half for security-related logs, with the schedule enforced through actual deletion.
Frameworks such as ISO 27001’s clock synchronization control require synchronized timestamps because they underpin the reliability of logs used as evidence in disputes, regulatory inquiries, or forensic investigations, not only for everyday operational troubleshooting.
At low traffic volumes, often yes. Past a certain scale, the volume of matching lines and the burden of manually cross-referencing several log files exceeds what a person can reliably process during a time-limited investigation, which is when centralized log aggregation becomes necessary rather than optional.
No. These platforms dramatically speed up finding and assembling relevant evidence, but they do not replace the judgment needed to correctly interpret what that evidence means, particularly distinguishing a genuine root cause from a coincidental correlation.
Reasonable signals include an investigation that has run for several hours without a clear root cause across more than one layer of the stack, or a recurring incident that keeps being addressed with the same mitigation without the underlying frequency actually decreasing.
Implementing a request correlation identifier that propagates from nginx through php-fpm and into application logging, since it converts cross-layer correlation from an approximate, error-prone process into an exact search.
It changes which layers are hard to correlate rather than eliminating the difficulty outright. Managed platforms often simplify clock synchronization and tracing across the layers they control, but CDN and cookie-driven caching issues typically persist regardless of what runs behind the CDN.
Author:
Jan Bielik
CEO & Founder of Webiano Digital & Marketing Agency

This article is an original analysis supported by the sources cited below
NGINX 502 Bad Gateway Error: PHP-FPM Datadog’s engineering blog explains the mechanics behind nginx 502 errors in an nginx and php-fpm deployment, including common causes and where to look in each system’s logs.
PHP-FPM monitoring checklist Netdata’s guide breaks down php-fpm’s process-based concurrency model and the layered signals operators need to monitor worker capacity and health in production.
PHP-FPM 504 gateway timeout A detailed operational breakdown of why 504 errors occur in nginx and php-fpm deployments, including the phantom worker problem and how to align timeout settings across layers.
Debugging PHP scripts using slow_log and more A practical walkthrough of configuring and interpreting php-fpm’s slow log for identifying slow-running PHP scripts.
PHP-FPM worker segfaults: how to diagnose? A FreeBSD forum thread documenting a real-world php-fpm worker crash investigation, illustrating how signal-level crash logs are read and interpreted.
Caching overview, Google Cloud CDN documentation Google Cloud’s official documentation on how its CDN builds cache keys, handles Vary headers, and treats cookies and signed URLs in caching decisions.
A complete guide to HTTP caching An in-depth guide to layer-by-layer HTTP cache debugging, covering CDN, proxy, application and database cache layers and common diagnostic traps.
How to debug CDN caching issues A systematic walkthrough of diagnosing CDN caching problems using headers, origin configuration and CDN-side logs.
CDN cache, Vercel documentation Official documentation explaining how the Vary header interacts with cache keys and CDN caching behavior on a modern edge platform.
Request-trace correlation guide A practical guide to implementing request ID generation and propagation for correlating logs and traces across distributed systems.
X-Request-ID header reference A technical reference describing the X-Request-ID header, its usage conventions, and its role in tracing requests across proxies and services.
How to configure NGINX W3C Trace Context propagation with traceparent A configuration guide showing how to combine nginx’s built-in request ID with W3C Trace Context headers for cross-service correlation.
Analyzing a MySQL slow query log with pt-query-digest A hands-on walkthrough of using Percona’s pt-query-digest tool to identify the highest-impact queries in a slow query log.
How to diagnose slow queries with the slow log, Performance Schema, and PMM A technical guide covering MySQL and MariaDB Performance Schema digest tables as a complement to the traditional slow query log.
Using slow query log to find high load spots in MySQL, Percona Percona’s own blog explaining how to use the slow query log and pt-query-digest to identify recurring high-load query patterns.
MariaDB slow query log: 5-step diagnostic guide A step-by-step guide to enabling and interpreting the MariaDB slow query log alongside Performance Schema statistics.
NTP drift on network devices: the silent killer of event correlation An explanation of how NTP clock drift accumulates undetected and undermines cross-system event correlation during incident investigations.
ISO 27001 Annex A control 8.17, clock synchronization A compliance-focused explanation of why synchronized clocks are required for reliable log correlation, forensic investigation, and evidentiary integrity.
Web cache poisoning, exploiting design flaws, PortSwigger Web Security Academy PortSwigger’s technical reference on how unkeyed headers and cookies enable web cache poisoning attacks against cached responses.
Cache poisoning, OWASP Foundation OWASP’s community reference describing the mechanics and impact of cache poisoning attacks on shared and browser caches.
GDPR logging, monitoring and log retention guide A practical compliance guide covering GDPR’s treatment of IP addresses and log data, including common retention tiering practices.
GDPR log management: a practical guide for engineers An engineering-oriented guide to handling personal data in logs under GDPR, including retention rules and pseudonymization practices.
EU data retention rules: GDPR storage limitation explained A detailed explanation of GDPR’s Article 5 storage limitation principle and its implications for documented, enforced retention schedules.
Cost of downtime in 2026, Gatling An analysis of published downtime cost benchmarks across company sizes, citing Splunk and Cisco research on the hidden costs of downtime.
What is the cost of downtime in 2026?, Dotcom-Monitor A benchmark roundup of ITIC, Gartner and Parametrix downtime cost figures for mid-size and large enterprises.
Cost of IT downtime statistics, data and trends A statistics-focused overview of downtime cost benchmarks across business sizes, including leading causes of outages.
The cost of downtime in 2026, statistics every engineering leader should know An overview of ITIC and Uptime Institute benchmarks on downtime cost per minute and mean time to recovery trends across industries.
| Citing this article? Brief excerpts are welcome. Please credit Webiano.digital, name the author where stated, and include a link to https://webiano.digital and to this original article. Full or substantial republication requires prior written permission. Read our Copyright and Content Use Policy. |
This article was prepared with the assistance of artificial intelligence tools. The content underwent expert human review, and Webiano Digital & Marketing Agency assumes editorial responsibility for its final version and publication.