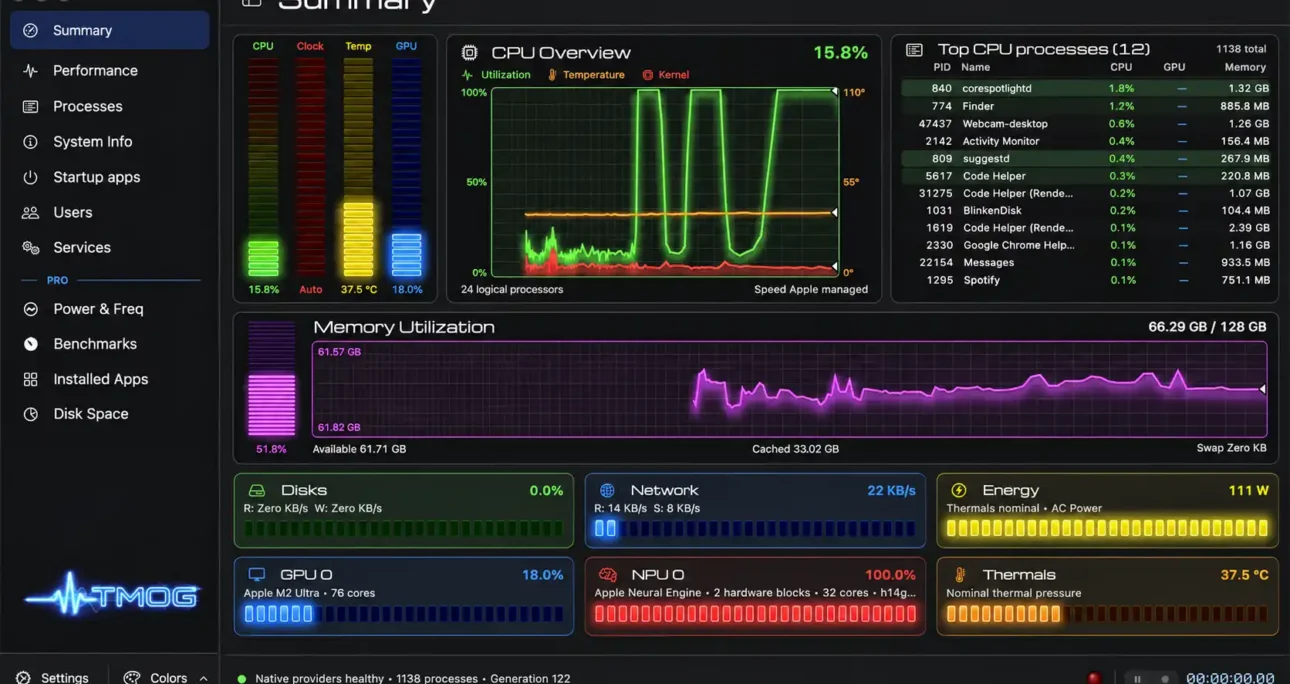
TMOG pairs a live view of system resources with a sortable process hierarchy. When a laptop fan spins up during a video call or an export slows halfway through, you can look for the resource under load and then see which processes were busy at the same time. That is the idea behind Task Manager OG, a desktop monitor from Dave Plummer, the developer behind the original Windows Task Manager. Tom’s Hardware reports that Plummer used Claude Code with a detailed specification to build an early version. The current desktop releases are listed separately in TMOG’s release notes.
Table of Contents
From a spinning fan to a process name
A practical starting point is Summary, then Performance, then Processes. Summary gives you the broad picture. Performance lets you inspect the resource or device that changed. Processes lets you sort and filter the live hierarchy to narrow the list of suspects. As Thurrott reported for the Windows edition, TMOG also lists dedicated views for system information, startup apps, users and services, with specialist pages such as Connections, Disk Space and Benchmarks among the tools the store advertises for Pro. TMOG says it pairs each process ID with a creation identity to guard against acting on a different process after the system reuses a number. A process at the top of a column is a lead. The timing of the symptom and whether it recurs under the same workload give that lead more weight.
One measurement core across three desktops
The vendor describes one shared C++20 measurement core under three desktop interfaces. The Mac app uses Swift and AppKit, the Windows build uses C++ and Win32, and the Linux build uses C++ and Qt 6 Widgets. TMOG says the interface contains no embedded browser or Electron shell. That describes how it is built. The processor time it takes to collect readings and draw the graphs is a separate question that depends on the build, machine and settings.
Desktop builds and requirements
| Platform | Interface | Published target | Version in the release notes |
|---|---|---|---|
| Windows | C++ and Win32 | Windows 11 on x64 or ARM64 | 1.1.1 |
| macOS | Swift and AppKit | macOS 14 or later on Apple silicon or Intel x64 | 1.1.0 |
| Linux | C++ and Qt 6 | x64 or ARM64 desktop with glibc 2.35 or later and libstdc++ 12 or later | 1.1.1 |
As also reported by OMG! Ubuntu, the Linux download page lists AppImage, Debian package and tar archive builds. The Debian package and tar archive also require system Qt 6.4 or later. TMOG recommends the AppImage for Ubuntu 22.04 and lists Debian 12 and later among systems that meet the underlying library requirements.
The shared interface vocabulary makes it easier to move between machines, but the release notes explicitly say sensor coverage varies. They also distinguish platform changes. Version 1.1 added Intel GPU readings and support for Linux systems without systemd. Windows gained a System Pressure tile and a File activity window. The 1.1.1 hotfix addressed settings persistence and in-app updates on Windows and made Pro activation easier to reach on Linux desktops that move the menu bar. A version-specific bug report is more useful than a claim about “TMOG on Linux” or “TMOG on Windows” in general.
The readings that narrow a slowdown
Start with the resource that changes when the symptom starts. A hypothetical video export might keep a few logical processors busy while the overall CPU graph looks moderate. The per-processor view gives you a reason to inspect how the load is distributed. A separate export might coincide with sustained activity on the destination drive. Compare the device graph and the export process over the same interval. If the interface freezes while disk activity climbs, the next experiment is to repeat the export under comparable conditions with a different destination. A single high reading records activity. A repeatable change gives you evidence about whether that activity matters.
Memory deserves the same care. A large process reading and system-wide memory pressure answer different questions. TMOG’s published memory view includes pressure, cache, compression and swap. PC Gamer’s August beta test found similar system-wide memory usage in TMOG and Windows Task Manager while some per-app readings differed. The report did not establish the reason. Before deciding that an app leaked memory, compare the metric labels and how each tool groups processes. On Linux, the kernel’s Pressure Stall Information separately measures time workloads lose to contention for CPU, memory or I/O. It is a useful cross-check when the question is whether jobs are waiting for resources.
Missing measurements and the cost of watching
Zero, unavailable and a gap carry different meanings in TMOG’s documented design. Zero is a reading. An unavailable value means the app lacks a usable measurement. A gap preserves a period for which it has no sample. On Linux, the vendor explains that CPU package power can come from the kernel’s powercap energy counters. The kernel documentation describes power zones and subzones, so the scope of a reading matters. Package power is one part of a machine’s energy use. If TMOG displays restricted access, check which counter it names before drawing conclusions about power consumption.
Sensor labels deserve scrutiny even when a value appears. In one public Windows report, users described an older build showing a flat ACPI thermal-zone reading while a separate tool showed changing CPU package temperatures. A separate report described missing CPU thermals on a Ryzen system, including in Flight Recorder. These are reports about particular configurations. Check the sensor source and its response to a known workload before trusting a number you plan to act on. TMOG also offers self-monitoring. PC Gamer observed higher CPU use than Windows Task Manager in its beta test on one PC, and the 1.1 notes report drawing changes on Windows and Linux. For your machine, compare the same workload with TMOG visible and closed, using another tool to observe both runs.
Live monitoring and saved evidence
Free TMOG covers live monitoring. Pro adds Flight Recorder, which saves telemetry for later replay. The vendor says the three desktop builds use the same trace format and record seven telemetry panels. That is most useful when a slowdown is short enough to disappear before you can switch windows. Set up a capture before reproducing the problem, note when the application stutters, and use replay to inspect what changed around that point. For Windows file, Registry or thread events, Microsoft’s Process Monitor answers a more granular question. A telemetry graph can tell you when to look. An event trace can show what a process did during that interval.
Free monitoring and the Pro upgrade
| Need | Edition | What the vendor describes |
|---|---|---|
| Inspect a slowdown while it happens | Free | Live monitoring, processes and performance graphs |
| Save and replay a slowdown | Pro | Flight Recorder for Windows, macOS and Linux |
| Inspect more specialised areas | Pro | Power and frequency, connections, installed apps, disk space and benchmarks |
The current store lists Pro Personal at US$39.95 as a one-time purchase before applicable tax, with up to three simultaneous computer activations in any mix of the three desktop platforms. The same download is unlocked with a license key.
Local measurement, licensing and sharing are separate activities. The vendor says ordinary monitoring does not upload system metrics and that Pro verifies an activated entitlement locally. Its privacy notice also describes update and offer requests, a separate activation transaction, and optional data transfers. The store and privacy notice describe iPhone remote viewing support differently, so anyone buying specifically for that feature should verify compatibility for their desktop build first. The public GitHub repository is a feedback tracker. Its README says the application code is maintained privately. Before sharing a screenshot or diagnostics, remove details such as usernames, process arguments and paths, as TMOG’s feedback guidance requests.
A desktop tool that earns its place during triage
TMOG is useful when you want one desktop view that connects resource graphs and a process list. Reach for Microsoft’s Process Explorer when you need to identify which process holds a particular handle or has loaded a DLL. On Linux, htop provides a text-mode process view, and nvtop focuses on GPU and accelerator activity. WSL 2 adds another boundary. Microsoft documents that Linux runs inside a managed virtual machine, so if the Windows side points to WSL activity, inspect the individual Linux jobs from inside the distribution as well. The shared TMOG interface is convenient when you move between operating systems, while these tools give you views tailored to specific questions.
Try the free edition on a slowdown you already know how to reproduce. If it shows the device or resource you care about and gives you a process worth investigating, it has done the job that matters. Flight Recorder earns its place when the problem keeps ending before you can see it live. In either case, the value of the graph is what it lets you check next.
Author:
Jan Bielik
CEO & Founder of Webiano Digital & Marketing Agency
This article is an original analysis supported by the sources cited below
Why is my Computer Slow? TMOG Knows Why!
Vendor overview of the shared core, native interfaces, measurements, desktop requirements and trace compatibility.
Release Notes — Task Manager TMOG
Documents the desktop version split, platform changes, rendering changes and known sensor limitations.
Linux notes — Task Manager TMOG
Explains the Linux CPU package energy provider and how restricted access is displayed.
TMOG Pro — Record a slowdown. Replay what happened.
Lists the free and paid features, Pro Personal price, activation terms and the store’s remote viewing description.
Privacy — TMOG
Describes local monitoring, application requests, license activation, remote viewing and optional transfers.
Feedback — Task Manager TMOG
Lists the diagnostic details to include in reports and the personal information to remove.
TMOG Feedback
Identifies the public issue tracker and explains its scope.
Windows veteran’s vibe-coded Task Manager now also runs on Mac and Linux — downloadable app is the result of a 107-page spec fed to Claude Code
Reports Plummer’s account of writing the specification and using Claude Code on an early build.
I tried the sequel to Task Manager and it has too many special effects
Records an August beta test on one PC, including differences in per-app memory readings and CPU overhead.
Ex-Microsoft dev builds a new task manager for Linux
Independent reporting on the Linux edition’s Qt interface, live monitoring and downloadable package formats.
Dave Plummer Has Made the Task Manager of Your Dreams
Reports how the Windows views relate to Task Manager and identifies specialist Pro pages.
Bug report 1380 — CPU Temperature Reports Static ACPI Thermal Zone Instead of CPU Package Temperature
Records user comparisons between an ACPI thermal zone and a CPU package sensor on specific Windows systems.
Bug report 1720 — CPU thermals of Ryzen 9800X3D
Records a user report of a missing temperature reading in both the live app and Flight Recorder.
Process Explorer v17.2
Microsoft documentation for finding open handles and loaded DLLs.
Process Monitor v4.12
Microsoft documentation for real-time file, Registry and process or thread activity.
Comparing WSL Versions
Explains the Linux kernel and managed virtual machine used by WSL 2.
PSI – Pressure Stall Information
Defines the Linux kernel interface for measuring time lost to CPU, memory and I/O contention.
Power Capping Framework
Defines the Linux kernel’s power zones and the energy counters available through its framework.
htop – an interactive process viewer
Project home documenting htop’s text-mode process interface.
NVTOP
Project repository describing GPU and accelerator process monitoring.
| Citing this article? Brief excerpts are welcome. Please credit Webiano.digital, name the author where stated, and include a link to https://webiano.digital and to this original article. Full or substantial republication requires prior written permission. Read our Copyright and Content Use Policy. |
This article was prepared with the assistance of artificial intelligence tools. The content underwent expert human review, and Webiano Digital & Marketing Agency assumes editorial responsibility for its final version and publication.