Vostok’s record belongs to thermometers and energy-balance physics. AI enters through the gaps around it: forecasters trained on past weather underestimate records, a 2026 benchmark left Antarctica out, and reconstruction networks fill a continent where one gridded dataset holds data in only about 10 percent of cells.
Table of Contents
At 02:45 UT on 21 July 1983, a thermometer at Vostok Station in East Antarctica read -89.2°C. The station stands on the high plateau, 3,488 metres above sea level, and the World Meteorological Organization still lists the reading as the lowest air temperature ever measured on Earth. Neither the 1983 reading nor its 2009 explanation involved artificial intelligence. The first detailed published analysis, led by John Turner of the British Antarctic Survey, combined reanalysis fields, station records and satellite imagery and traced the reading to five physical conditions that held together for about a week. The AI connection is indirect and recent. A 2026 study in Science Advances found that three leading data-driven forecasters underestimate record-breaking weather, with errors growing as a record is beaten by more, and its benchmark excluded Antarctica altogether. Separately, neural networks now fill temperature maps of a continent where a 2026 preprint found data in only about 10 percent of grid cells after 1961. This analysis argues that Vostok is relevant to AI as a hard test case and as a scarce data source, and that no published evidence yet shows AI forecasting or reconstructing anything close to the 1983 extreme.
A thermometer reading, not a model output
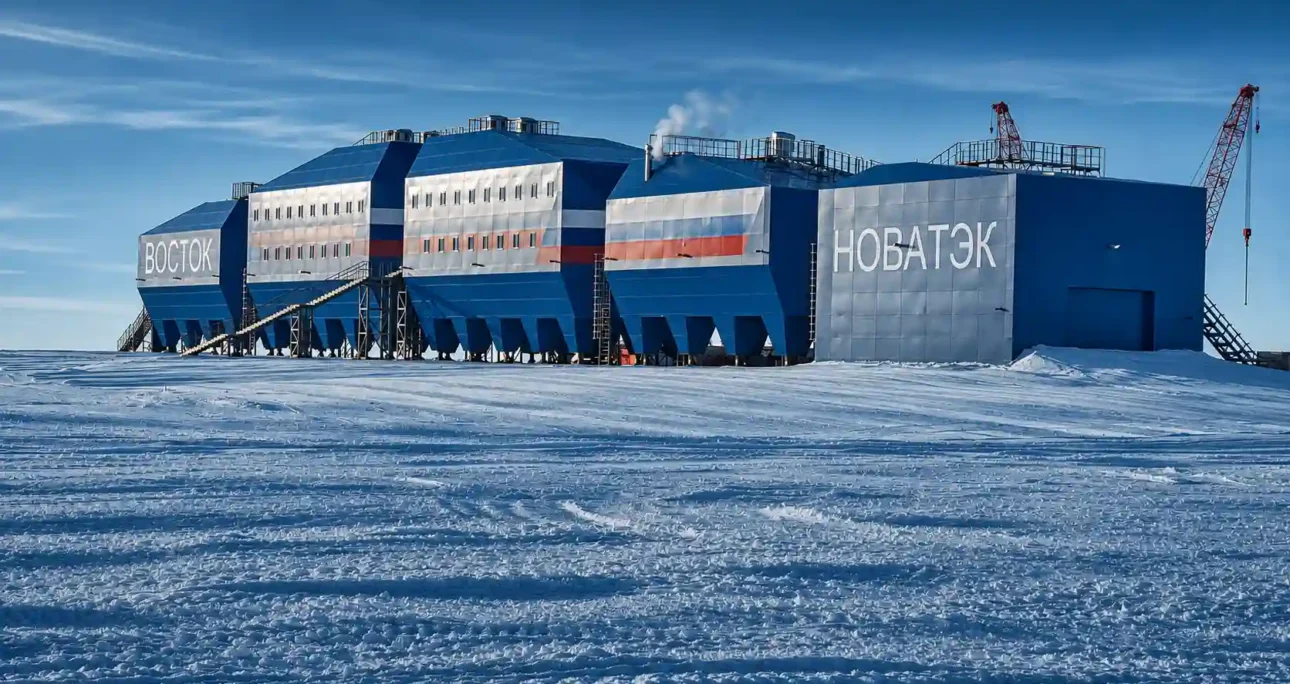
The premise behind this question needs a correction before anything else. Common descriptions of Vostok cover a station at about 3,500 metres on the East Antarctic plateau, a record temperature and a lake beneath the ice, and none of those facts involves AI. Turner and colleagues place the station at 78.5 degrees south, 106.9 degrees east and 3,488 metres above sea level, and Polar Journal describes it as Russia’s only inland Antarctic station, roughly 1,500 kilometres from the coast.
The World Meteorological Organization lists the 21 July 1983 reading as the coldest temperature on record. Its archive’s Northern Hemisphere record, -69.6°C at the Klinck automatic station on the Greenland ice sheet on 22 December 1991, is 19.6 degrees warmer, a figure calculated from the two WMO values. July 1983 was also the coldest July in the station’s record from 1958 to 2007, with a monthly mean of -73.8°C against a long-term July mean of -66.9°C.
For a quarter of a century the reading was quoted without a published explanation. Turner and colleagues wrote in 2009 that the record was widely repeated in books and on the web, that it had been announced in a Russian publication soon after the event, and that nobody had investigated the mechanisms behind it. The record is a measurement that physics explained 26 years later, a gap calculated from 1983 to 2009. That gap is the first reason AI cannot claim it: the explanation that exists came from observations and physical reasoning, and the AI forecasting models discussed below were published in 2023, 40 years after the reading.
Five conditions and a 30-kelvin slide
Turner and colleagues rebuilt the event from the station’s six-hourly reports, daily radiosonde ascents, two reanalyses and satellite imagery. Surface air temperature fell by 30.8 kelvin over 10 days and 6 hours, from -58.0°C at 18:00 UT on 10 July to -88.8°C at 00:00 UT on 21 July. The official register entry of -89.2°C followed at 02:45 UT. The previous lowest value in the six-hourly record was -87.6°C, measured on 24 August 1960.
The authors identify five conditions. The core of the mid-tropospheric vortex was near a record-low temperature, its centre moved close to the station, and a nearly circular flow persisted around the station for a week, which blocked warm air from lower latitudes. Surface winds were low for the location, and no cloud or diamond dust was reported for a week, so the snow lost heat to space as longwave radiation without replacement. Deep cold at Vostok needs a long isolation from maritime air, which explains why warm intrusions are the more common deviation: in July and August, 16 percent of reports ran more than one standard deviation above the mean and 11 percent more than one standard deviation below it.
The final hours add a feedback. As the surface cooled, turbulence in the stable boundary layer collapsed, the sensible heat flux that carries warmth to the snow fell towards zero, and cooling continued. Turner and colleagues infer this and note that it works only on flat terrain, because a slope keeps turbulence alive through katabatic winds. Extrapolating the energy balance, they estimate that a longer isolation could take Vostok to about -96°C.
The size of a cold slide does not predict where it ends. In August 2001 the station cooled by 38.2 kelvin in 9 days and 6 hours, more than in 1983, yet reached only -79.8°C. Any system that claims to forecast the extreme has to know the starting state, the duration of isolation and the point where the boundary layer decouples, and the 2009 paper reached that knowledge with an energy-balance model rather than a trained network.
Trained forecasters lose the physics at the cold tail
The models in the 2026 benchmark, GraphCast from Google DeepMind, Pangu-Weather from Huawei Cloud and FuXi from a Shanghai team, learned mostly from ERA5 reanalysis for 1979 to 2017. The study’s authors describe them as purely data-driven: they apply no knowledge of physical principles, enforce no energy balance and mainly interpolate between historical weather patterns. The physics-based comparison model, ECMWF’s HRES, beat all three on record-breaking heat, cold and wind across nearly all lead times, although GraphCast and FuXi beat it on 2 m temperature when all events were counted.
A record in that study meant any 2018 or 2020 value beyond the 1979 to 2017 extreme for the same grid cell and calendar month. For 2020 that produced 162,751 heat, 32,991 cold and 53,345 wind records over land. Forecast error grew almost linearly with the margin by which a record was beaten, which the authors read as an implicit soft cap near the most extreme training observation. For cold records, the AI forecasts ran too warm. HRES showed no such bound, and its error stayed close to constant for temperature records.
The benchmark could not test the Antarctic case directly. Its authors excluded every grid cell south of 60 degrees south, citing aberrant behaviour of some AI models in that region. Vostok’s 1983 reading sits inside the 1979 to 2017 window, so it belongs to the history these models learned from, but only as ERA5 represents it. Turner and colleagues warned that reanalysis fields over the plateau are less reliable than over the Southern Ocean, and Ouyang and colleagues cite earlier studies reporting substantial seasonal biases in ERA5 near-surface temperature over Antarctica.
No public comparison of ERA5 or an AI model with the 1983 reading was identified, so what follows is an inference. A model that reproduces a reanalysis faithfully also reproduces its weaknesses at the cold tail, and a forecast of the -96°C that Turner’s energy balance allows would sit beyond whatever cap the training data sets.
Antarctica’s thin data and who pays to fill it
Observational data from Antarctica remain extremely scarce and unevenly spread in time, in the words of the reconstruction literature. An Ohio State preprint from 2024 puts the true sparsity of Antarctic temperature fields above 90 percent and counts between 41 and 65 operable stations in 1998 to 2008, the last decade of its training data. A 2026 preprint in Earth System Science Data, by Ouyang and colleagues at Sun Yat-sen University, finds that station coverage stayed around 10 percent of the grid after 1961 despite 81 stations, because most stations sit on the coast or near research bases while the interior plateau stays sparse. Vostok is one of the few long plateau records, yet Turner and colleagues documented its gaps: no surface data for 1962, more gaps after 1994 and no radiosonde ascents after 1991.
Filling gaps with a neural network costs hours, while filling them with steel costs years. Ouyang and colleagues ran their computations on a single NVIDIA GeForce RTX 4060 for about eight hours. The new Vostok wintering complex, by comparison, was assembled in Gatchina from Russian and Belarusian components, shipped first in 2020 on a freighter that turned back with a broken propeller, loaded again in October 2021, hauled across about 1,500 kilometres from the coast and put into test operation on 28 January 2024, according to Polar Journal. That contrast compares time, not budgets; none of the sources reports a cost for either.
The reconstruction teams know the limits of their inputs. Ouyang and colleagues kept stations with more than 25 valid years between 1961 and 1990, gap-filled them following Bromwich and colleagues, and ran homogenisation tests to remove jumps caused by station moves and sensor changes. Those steps show how much human judgement sits inside a dataset that a network then treats as ground truth: an error in the cleaned record becomes part of what the model learns.
Speed is the second incentive. The Ohio State authors describe reanalysis models as slow compared with truly real-time data and argue that deep learning can cut that latency. Their best Antarctic reconstruction still showed a root mean square error of 4.667 kelvin, which they call large for climate work, and they state that more work is needed before the method can be trusted.
Four studies on AI and Antarctic temperature
| Study | Task | Reported result | Stated limit |
|---|---|---|---|
| Zhang et al., Science Advances, 2026 | Forecast record heat, cold and wind with GraphCast, Pangu-Weather and FuXi | Physics-based HRES beat all three on records; AI errors grew with record size | Antarctica excluded from evaluation |
| Ouyang et al., ESSD preprint, 2026 | Fill gaps in global surface temperature | Mean correlation 0.72 and RMSE about 0.6°C at 14 held-out Antarctic stations | Worst fit at Dome A, RMSE 1.17 to 1.28°C |
| Sunderhaft et al., arXiv, 2024 | Reconstruct Antarctic monthly temperature from sparse stations | Best RMSE 4.667 K on a 10-year hold-out | Authors say more work is needed before deployment |
| Guk, EMS abstract, 2026 | Compare GraphCast winds with ERA5 and station data | GraphCast tracks ERA5, which deviates from stations | Four low-altitude stations only |
Each study measures a different task, so the rows are not a ranking. Only the first concerns record extremes, and it excluded Antarctica. The others work with monthly anomalies or wind speed, which are smoother quantities than a single 2 m reading on one night in July 1983. The table states results as the authors report them.
Fidelity to the reanalysis is not accuracy
A conference abstract by Elena Guk, an independent researcher, shows why a high score against ERA5 proves less in Antarctica than elsewhere. Guk compared 24-hour GraphCast forecasts of monthly mean 10 m wind speed with ERA5 and with SCAR READER station observations at four low-altitude Antarctic stations for 2018 to 2020. ERA5 deviated substantially from the observations at all four. GraphCast stayed close to ERA5 at every station, and its errors against the observations were larger than ERA5’s own at three of the four. The author calls the sample too small for strong conclusions, the quantity is wind rather than temperature, and the abstract is a preliminary submission, not a peer-reviewed paper.
The pattern still carries a warning for how Antarctic skill gets reported. Most AI weather models are scored against ERA5, so a model can look excellent while measuring only its agreement with the reanalysis it learned from. Where ERA5 itself departs from stations, as the abstract and the studies cited by Ouyang and colleagues report, that agreement overstates reliability. The polar interior has the fewest stations to check against, so the overstatement is likely to be largest there; this is an inference, because no identified study tests the plateau directly.
The consequences reach beyond forecasting. The choice of reconstruction decides whether Antarctic warming since 1979 can be distinguished from zero. In the Ouyang preprint, the AI reconstructions, a reconstruction by Bromwich and colleagues and NOAAGlobalTemp show Antarctic trends since 1979 that are not distinguishable from zero, while HadCRUT5, Berkeley Earth and ERA5 show detectable warming. The simple average of the 81 stations sides with the higher estimates, and the authors say the contribution of statistical and assimilation methods to the gap remains to be quantified. Climate-record builders, polar operators and anyone quoting an Antarctic trend therefore inherit a methodological choice that the headline number rarely reveals.
Ice cores, where Vostok data and machine learning could meet
Vostok’s best-known scientific product is its ice rather than its thermometer. In January 1998 the Russian, American and French drilling project reached 3,623 metres, the deepest ice core recovered as of the 1999 Nature paper by Petit and colleagues, and stopped about 120 metres above the lake to avoid contaminating it. That paper used the core to reconstruct 420,000 years across four glacial cycles. Carbon dioxide and methane tracked Antarctic temperature closely, with r-squared values of 0.71 and 0.73, and the 1999 levels of about 360 parts per million and 1,700 parts per billion were unprecedented in that period.
The chronology came from an ice-flow and accumulation model, not from pattern recognition. The GT4 timescale was anchored at two control ages and carries an accuracy better than 5,000 years over the last 110,000 years and better than 15,000 years throughout. Dating uncertainty of that kind is where machine learning could eventually help or hurt, and no reliable public source identified a machine-learning re-dating of the Vostok core.
The declared role of AI in ice-core science sits elsewhere. AiCE, a European Research Council project hosted by the Alfred Wegener Institute in Bremerhaven, runs from 1 January 2024 to 31 December 2028 with EU funding of about 1.98 million euros. It aims to apply deep learning to microscale chemical images of the oldest Antarctic ice and test whether the signal from the Mid-Pleistocene Transition, about 1.2 million years ago, survives in the deepest layers. Its description cites the limits of human observers in reading such images as the reason for using AI. It does not name Vostok.
Vostok does hold material that such methods could examine. According to TASS, the director of the Arctic and Antarctic Research Institute says the station’s archive holds more than five kilometres of ice cores kept at about -55°C. A new storage facility is under construction because the old stores are buried in snow and deforming, and no new samples arrive while ultra-deep drilling over the lake is suspended. No reliable public source identified a machine-learning study of those cores, and that absence is a gap in the record rather than a finding.
Three ways this reading could be wrong
The first weakness is the missing direct test. The benchmark’s authors excluded Antarctica, and the underestimation of records was shown over land elsewhere, so applying it to Vostok is an extrapolation of the same kind the study criticises. No identified study tests an AI model against the Vostok reading. The expectation that AI would underestimate a Vostok-scale cold record rests on structural reasoning, which is strong, and not on a result.
The second weakness is the age of the tested models. Leonardo Olivetti of Uppsala University told Carbon Brief that GraphCast, Pangu-Weather and FuXi are an older generation and that newer probabilistic models claim to capture extremes better. Study author Sebastian Engelke said probabilistic models, which produce several possible future states, are more likely to capture records. The paper itself suggests that even these models probably face similar extrapolation limits, and it proposes hybrids that pair physical models with AI components. That remains a hypothesis, untested on Antarctic extremes.
The third weakness is that AI does well at a different job. Ouyang and colleagues report correlations near 0.9 with held-out test data and errors below 1.3°C after 1961, and an average correlation of 0.72 at 14 independent stations. Those figures describe monthly anomalies on a grid of 5 degrees by 2.5 degrees, and 2.5 degrees of latitude spans about 280 kilometres, a figure calculated from the length of a degree, so they say little about one night’s extreme at one thermometer. Dome A, the highest point of the East Antarctic Plateau and a site where records reach extreme lows, was the hardest station to reconstruct, which hints at the limit without testing it. Most of the AI-side evidence is also provisional: two preprints and a conference abstract sit beside one peer-reviewed benchmark.
Decisions for forecasters, data teams and editors
Four kinds of reader face concrete choices, and each choice has a condition that would reverse it.
Forecast centres deciding how far to trust AI products in polar and extreme-cold conditions should keep physics-based runs alongside them. The benchmark’s authors say it remains vital to fund and run numerical and AI models in parallel and to test them on the most damaging events. The condition for relaxing that: a published evaluation that includes Antarctic plateau grid cells, scored against in situ observations, and shows parity on cold records.
Teams building reconstructed temperature datasets should report validation at plateau sites separately from coastal ones, and for extreme months separately from average ones. Ouyang and colleagues’ weakest station was Dome A, and Guk’s abstract argues that in situ polar observations expose blind spots that reanalysis-based benchmarks miss. AI reconstruction depends on stations that still report, so cutting stations to save money is likely to degrade the product meant to replace them. The preprint supports the mechanism: when large missing regions hold no valid data, as in the polar regions before 1961, correlation and error deteriorate substantially.
Research funders weighing algorithms against fieldwork should note that every method in this evidence needs preserved samples or working stations to read. The head of Vostok Station told TASS that the existing core stores are under thick snow and falling into disrepair, and the 2009 review of Vostok’s own surface record found increasing gaps after 1994. A storage and maintenance line may decide more of the usable data than an algorithm line.
Editors and content teams should trace any sentence that links Vostok to AI back to the WMO entry and the 2009 Journal of Geophysical Research paper. The sources reviewed here contain no AI involvement in the record, so a claim of one needs its own citation.
The next Antarctic extreme and the evidence that would revise this view
The evidence supports one judgment now: Vostok’s record is a thermometer and physics result, and the strongest documented role of AI around it is filling data gaps rather than forecasting extremes. That judgment is analysis, and four developments would revise it.
The first is a benchmark that keeps Antarctic grid cells and scores forecasts against in situ plateau observations, including the coldest months. The second is probabilistic or hybrid models evaluated on records, since the benchmark authors name both as candidates. The third is the AiCE results, due before its grant ends on 31 December 2028, which would show whether deep learning can read the oldest Antarctic ice. The fourth is a published machine-learning study of the Vostok cores themselves, which no reliable public source identified.
A new record would test the physics before it tested any AI. Turner and colleagues estimate about -96°C at Vostok under a longer isolation, and about -95°C at Dome Argus, which sits 595 metres higher, under the 1983 conditions. They also note that mid-tropospheric winter warming over Antarctica has slightly reduced the conditions that suit very low temperatures, so more AI does not make a new record likelier. The Vostok station itself is changing: its new wintering complex began a test run in 2024 and, according to Polar Journal, needed about two more years to finish.
The -89.2°C record will most likely stay an instrument reading explained by energy-balance physics, and AI will reach Vostok first through its data: the gappy plateau record, the stored cores and the reanalysis that other models learn from. The evidence that would overturn that outlook is specific. A trained model, tested blind against plateau stations, would need to forecast a record-cold night to within a few kelvin several days ahead.
Reader questions on Vostok Station and artificial intelligence
No reliable public source identified any AI involvement. The 1983 reading was a thermometer measurement entered in the station’s register, and the 2009 analysis in the Journal of Geophysical Research used station reports, radiosondes, reanalysis fields, satellite imagery and a radiative transfer model.
The World Meteorological Organization lists -89.2°C (-128.6°F), measured at Vostok Station in Antarctica on 21 July 1983. The 2009 analysis places the reading at 02:45 UT.
Through three indirect links: tests of AI weather forecasters on record-breaking extremes, AI reconstruction of sparse Antarctic temperature data, and deep-learning projects on the oldest Antarctic ice. None of the three has been shown to involve the 1983 reading itself.
No public test answers this. A benchmark of GraphCast, Pangu-Weather and FuXi found that AI errors grow as a record is beaten by more, and the cold-record forecasts ran too warm, but it excluded Antarctica.
Its authors left out every grid cell south of 60 degrees south, citing aberrant behaviour exhibited by some AI models in that region. The study does not say which models or what the behaviour was.
It depends on the task. A 2026 preprint reports correlations near 0.9 and errors below 1.3°C against test data after 1961, while a 2024 preprint reports an error of 4.667 kelvin for its best monthly reconstruction. The two use different data and methods, so the figures are not directly comparable.
No reliable public source identified such a study. The AiCE project applies deep learning to chemical images of the oldest Antarctic ice, but its description does not name Vostok. The Vostok core itself gave a 420,000-year climate record in 1999.
The 2009 analysis estimates that Vostok could reach about -96°C with a longer isolation from maritime air, and that Dome Argus would have recorded about -95°C under the 1983 conditions. The same paper notes that winter warming in the mid-troposphere has slightly reduced the conditions that favour such cold.
Lake Vostok, buried under nearly 4 kilometres of ice. Russian scientists reported reaching its surface in February 2012, the first of more than 300 known Antarctic subglacial lakes to be reached, according to RNZ.
Author: Jan Bielik CEO & Founder of Webiano Digital & Marketing Agency
This article is an original analysis supported by the sources cited below
WMO verifies -69.6°C Greenland temperature as Northern hemisphere record The WMO press release establishing that Vostok’s -89.2°C of 21 July 1983 is the world’s coldest recorded temperature and giving the -69.6°C Northern Hemisphere record at Klinck on 22 December 1991.
Record low surface air temperature at Vostok station, Antarctica Turner and colleagues’ 2009 Journal of Geophysical Research analysis of the 1983 event, supplying the station coordinates, the 30.8 kelvin cooling, the five conditions, the energy-balance feedback and the -96°C estimate.
Numerical models outperform AI weather forecasts of record-breaking extremes The Zhang, Fischer, Zscheischler and Engelke benchmark showing that GraphCast, Pangu-Weather and FuXi underperform ECMWF’s HRES on records, with the soft-cap finding, the record counts and the exclusion of Antarctica.
Traditional models still ‘outperform AI’ for extreme weather forecasts Carbon Brief’s report, republished by Resilience, confirming publication of the benchmark in Science Advances and adding comments from Olivetti, Engelke and Fischer on newer probabilistic models.
An AI-driven reconstruction of global surface temperature with emphasis on refining the Antarctic record The Ouyang, Li, Li and Wei preprint supplying the roughly 10 percent Antarctic coverage, station validation figures, Dome A results, hardware used and the divergent post-1979 trends.
Deep learning improvements for sparse spatial field reconstruction The Sunderhaft, Frank and Davis preprint giving the Antarctic sparsity above 90 percent, the 41 to 65 operable stations, the 4.667 kelvin error and the authors’ caution about deployment.
GraphCast faithfully reproduces ERA5 near-surface wind speed at Antarctic stations Elena Guk’s EMS 2026 abstract comparing GraphCast, ERA5 and station winds at four Antarctic stations, used for the point that fidelity to ERA5 differs from accuracy.
Deep ice – Deep learning. Artificial intelligence revealing the oldest ice climate signals The CORDIS record of the AiCE project, giving its host institution, dates, funding, aims and the stated reason for using deep learning on the oldest Antarctic ice.
Climate and atmospheric history of the past 420,000 years from the Vostok ice core, Antarctica The 1999 Nature paper by Petit and colleagues, supplying the 3,623 metre core, the greenhouse-gas and temperature correlations and the GT4 timescale with its stated accuracy.
Russian scientists to preserve ice over a million years old in new Antarctic storage facility The TASS-sourced report of 1 May 2026 on Vostok’s core archive of more than five kilometres, the deteriorating stores, the new facility and the suspension of ultra-deep drilling.
New Vostok station goes on a test run Polar Journal’s account of the new wintering complex, its 28 January 2024 commissioning, the transport history from 2020 and the station’s position as Russia’s only inland Antarctic base.
Lake Vostok reached by deep drill RNZ’s February 2012 report on Russian scientists reaching the surface of Lake Vostok beneath nearly 4 kilometres of ice, the first of more than 300 known subglacial lakes to be reached.
| Citing this article? Brief excerpts are welcome. Please credit Webiano.digital, name the author where stated, and include a link to https://webiano.digital and to this original article. Full or substantial republication requires prior written permission. Read our Copyright and Content Use Policy. |
This article was prepared with the assistance of artificial intelligence tools. The content underwent expert human review, and Webiano Digital & Marketing Agency assumes editorial responsibility for its final version and publication.