Meta’s average ad price rose 23% for US and Canadian audiences in a year, yet cost per sale for online stores barely moved in 2025, because click and purchase rates rose nearly as fast as prices. A creator’s explainer says rising costs prove advertisers are winning. The numbers back part of that, and show the winners are on a treadmill that speeds up each quarter.
Table of Contents
Meta’s own earnings show that the average ad price rose 23% in the US and Canada in the third quarter of 2026 and 14% worldwide, the highest US and Canada reading among the five quarters Meta charted. A large 2025 benchmark of nearly 35,000 ecommerce brands found something that looks like a contradiction: the price of reaching 1,000 people climbed 20%, yet cost per purchase rose only 1%. Both are true, and the distance between them is what advertisers are arguing about.
Ben Heath, who runs the Meta ads agency Heath Media and a YouTube channel about Facebook advertising, took up that argument in a video published on 20 October 2026, a day before Meta reported its latest numbers. He says costs rise because advertisers are getting results and that CPM is the wrong number to watch. The video is sponsored by HubSpot and also promotes his own paid ad community, so its advice carries a commercial motive. The sections below test his main claims against Meta’s filings and the datasets now available.
Meta’s price per ad is outrunning the supply of ads
Heath’s economics are plain: more advertisers chase a limited number of ad slots, so the price rises. Meta’s third-quarter release on 21 October 2026 fits that direction but adjusts the supply story. Ad impressions rose 10% and price per ad rose 14%, so price grew faster than volume, although volume was not frozen. A year earlier impressions had grown 14%. In the US and Canada impressions rose 8% while price rose 23%, and price growth there ran 13%, 9%, 14%, 20% and 23% over the five quarters Meta charted.
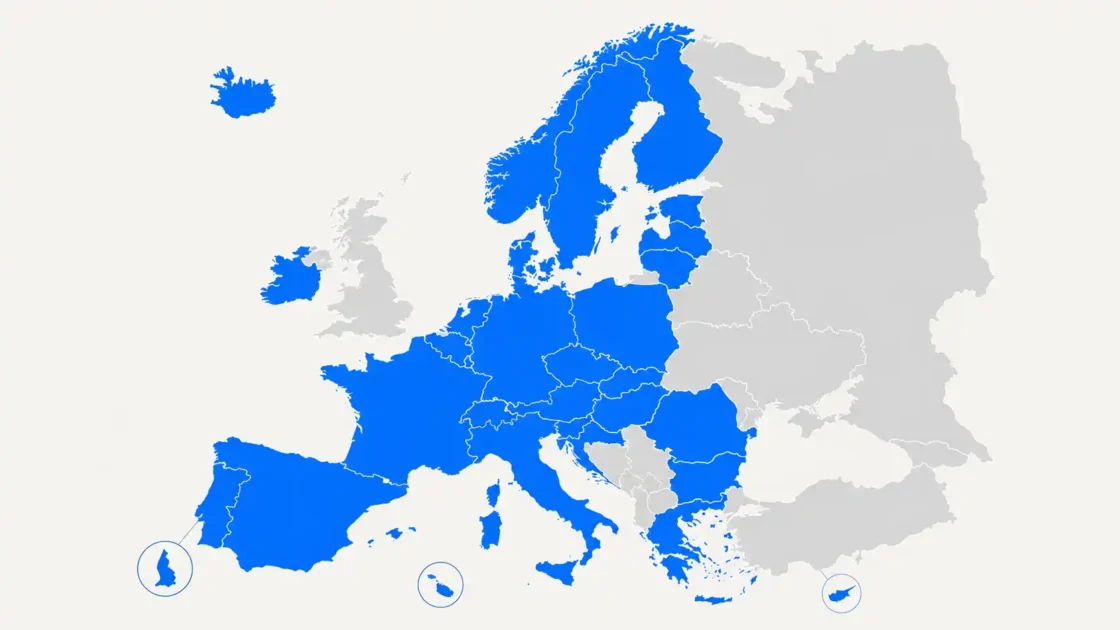
Chief financial officer Susan Li attributed the global rise to “ad performance gains and improvements in macro conditions”, partly offset by faster impression growth in lower-paying regions and surfaces. The regional split is wide. Europe saw a 10% price rise, Asia-Pacific 1% and the Rest of World 24%. Meta does not break out individual countries, so a reader outside those blocs cannot read their own market from the release.
A 20% rise in CPM that cost almost nothing per sale
Heath argues that CPM matters less than cost per conversion and return on ad spend. Triple Whale’s benchmark report, built from nearly 35,000 ecommerce brands using its software and updated in April 2026, supports him. Between 2024 and 2025 CPM rose 20.03%, from $11.82 to $14.19, while cost per acquisition moved from $37.80 to $38.19, a 1.04% increase. Click-through rate rose 13.5% and conversion rate 8.29%, from 1.48% to 1.6%.
Those two gains multiply to about 23% more purchases per impression, which roughly cancels the price rise. That is this article’s arithmetic from Triple Whale’s table, and the table’s averages do not reconcile exactly. The lesson is narrower than the claim that CPM does not matter. CPM sets how much better ads must convert just to stand still. Meta says its systems help: it estimates that advertisers who adopted its AI business assistant’s recommendations got almost 5% more conversions at the same cost per conversion, and that its ranking models lifted conversions by 1.4% to 9.6% depending on the system and campaign type. Those are Meta’s estimates, not independent tests, and single-digit gains look small beside a double-digit price rise.
Health and wellness paid most, and sources disagree on the headline
The average hides a wide spread. Triple Whale found CPM higher in all 15 industries it tracks, with rises between 8.08% and 38.03%. Health and wellness took the worst of it: CPM up 38.03% to a $20.70 median, the highest of any industry, and cost per acquisition up 12.64% to $38.55. Travel accessories and luggage saw click-through rise 17.09% while conversion fell 16.72%. Marketing efficiency ratio declined in 11 of 15 industries. Against that, seven of 15 industries cut their cost per acquisition, led by media and publishing at 11.72% lower.
One benchmark roundup disagrees. ContentStudio, a social media software vendor, updated its 2026 benchmarks on 17 September 2026 and reports cost per acquisition up about 38% beside a $38 median, the same level Triple Whale shows. Triple Whale’s own table gives 1.04%, and ContentStudio does not explain the gap. This article uses Triple Whale because it holds the underlying data, but both are vendor reports and neither is an audited statistic.
Two figures in the video need a footnote
Heath says Starbucks earns more than $14,000 from the average customer over a lifetime, so it can afford to pay $1,000 to win one. The figure traces to a ClickZ report from April 2016 on a conference talk by Thoryn Stephens, then chief digital officer at American Apparel. Stephens cited a 21% margin, 75% retention and a 20-year lifespan and arrived at a $14,000 lifetime value. ClickZ gives it as Stephens’s figure, not a Starbucks disclosure, it is more than ten years old, and the report does not say whether it measures revenue or profit. The point Heath draws is sound whatever the exact number: a business that earns more per customer can pay more to acquire one.
He also says half of all advertising budget goes to Google and Meta. Emarketer’s April 2026 forecast puts Meta at 26.8% and Google at 26.4% of worldwide digital ad spend this year, a combined 53.2% by simple addition, and 62.3% with Amazon. The base is digital advertising only, so the claim holds for digital spend and the forecast says nothing about the rest. The same forecast has Meta passing Google for the first time, $243.46 billion against $239.54 billion, and Marketing Dive’s coverage adds that the three platforms’ combined share is expected to keep rising through 2028.
Partnership ads are the advice with money behind it
Heath calls partnership ads, in which a creator’s post runs as a paid ad, the nearest thing to a silver bullet, and says almost no one asks him about them. Meta’s third-quarter figures show the format growing fast. According to Li, partnership ads grew more than 97% year on year and passed a $15 billion annual revenue run rate, and Meta finished rolling its Creator Marketing Hub out to all advertisers, with more than 10 million creators discoverable.
Those are company figures. They show how much advertisers spend on the format, not how well it converts, and none of them compares partnership ads with other formats. The silver bullet label remains Heath’s opinion. His other advice, patience before judging a test and keeping emotion out of the results, cannot be checked against data and rests on his experience of running campaigns.
Checks a small advertiser can run this week
Compare your own account with the benchmarks, not with the anecdotes in the video. Heath mentions advertisers in California in a lucrative niche who should expect a CPM of $100 or more. Triple Whale’s highest industry median in 2025 was $20.70, so $100 is about five times that: possible for a narrow, high-value audience, but an outlier rather than a norm. Start with cost per sale and customer value, and treat CPM as a diagnostic.
Then set your year-on-year CPM beside the regional price growth Meta reported for the third quarter: 23% for US and Canadian audiences, 10% for Europe, 1% for Asia-Pacific. If yours rose faster than your region’s average, that points first to creative or audience rather than to the auction, as Relevant Audience also suggests. Thin margins feel the squeeze first. Media and publishing brands had the lowest return on ad spend in Triple Whale’s data at 1.17, with an average order value of $42.64, which leaves little room if prices keep rising.
A treadmill that keeps getting faster
Heath is right on the central points. Meta’s advertising revenue grew 26% to $63.06 billion in the quarter, a pace that is hard to square with advertisers abandoning the platform, and CPM alone misleads. What the video leaves out is the pace of the climb. In 2025 the typical online store had to lift click and purchase rates by roughly 23% combined to keep cost per sale flat. In the US and Canada, price per ad is now rising at 23% in the latest quarter, although average price per ad across Meta’s apps and median CPM among Triple Whale brands are different measures. Meta’s average revenue per person reached $17.72, up 44% from $12.29 two years earlier, according to Investing.com’s summary of Meta’s slides.
The evidence supports the view that the platform still works for advertisers who keep improving better than either the claim that it is dead or the claim that costs do not matter. One observable development would change that reading: if Triple Whale’s next annual benchmark shows cost per acquisition climbing in step with CPM, the treadmill has outrun creative gains, and the complaints Heath describes as a small minority’s view will have data behind them.
Author:
Jan Bielik
CEO & Founder of Webiano Digital & Marketing Agency
This article is an original analysis supported by the sources cited below
What’s happening to Facebook Ads right now?
Ben Heath’s video of 20 October 2026, sponsored by HubSpot, arguing that rising Meta ad costs reflect advertiser results and that CPM is the wrong metric; the claims tested in this article.
Meta Reports Third Quarter 2026 Results
Meta’s own release of 21 October 2026, establishing a 10% rise in ad impressions, a 14% rise in average price per ad and advertising revenue of $63.06 billion.
Facebook Ad Benchmarks by Industry (Updated Data)
Triple Whale’s 2025 benchmark of nearly 35,000 ecommerce brands, establishing CPM up 20.03% and cost per acquisition up 1.04%, plus the industry-level spread.
Meta to Surpass Google in Digital Ad Revenues for First Time Ever
Emarketer’s April 2026 forecast, establishing Meta’s 26.8% and Google’s 26.4% shares of worldwide digital ad spend and the 62.3% share of the top three platforms.
All customers are not created equal, says American Apparel CDO
ClickZ’s April 2016 report of the conference remark that is the traceable origin of the $14,000 Starbucks lifetime value figure, with the margin, retention and lifespan behind it.
Meta Q3 2026: APAC ad prices +1% as impressions rise 14%
A regional breakdown of Meta’s third-quarter price and impression changes, the five-quarter US and Canada price series, and the CFO’s partnership ads and AI tool figures.
Meta Platforms Q3 Earnings Call Highlights
A summary of the 21 October 2026 earnings call, establishing Meta’s own estimates of conversion gains from its AI business assistant and ranking models.
Meta Q3 2026 slides: revenue surges 26% as margins compress sharply
A walk-through of Meta’s earnings slides, establishing the slowdown in impression growth from 14% to 10% and average revenue per person of $17.72.
Meta Ads benchmarks: Average CPM, CPC, and CTR in 2026
A vendor benchmark roundup updated 17 September 2026 that reports cost per acquisition up about 38%, the figure that conflicts with Triple Whale’s data.
Meta to shoot past Google in digital ad revenue for first time: Emarketer
Independent trade coverage of the Emarketer forecast, adding that the combined share of Google, Meta and Amazon is expected to rise through 2028.
| Citing this article? Brief excerpts are welcome. Please credit Webiano.digital, name the author where stated, and include a link to https://webiano.digital and to this original article. Full or substantial republication requires prior written permission. Read our Copyright and Content Use Policy. |
This article was prepared with the assistance of artificial intelligence tools. The content underwent expert human review, and Webiano Digital & Marketing Agency assumes editorial responsibility for its final version and publication.