A Meta ads consultant says unit economics decide campaigns, and his arithmetic checks out. The trouble sits in the inputs: averages, a fixed acquisition cost and repeat-purchase counts that many new customers never reach. Salon data, scaling costs and SaaS benchmarks show a ratio of 10 is a spreadsheet result until cohorts, payback and marginal costs confirm it.
Table of Contents
The LTV to CAC ratio sets what a customer yields in lifetime gross profit against what it cost to win them, and a ratio above 3 is the standard yardstick. The venture investor David Skok wrote on his For Entrepreneurs blog that the best software-subscription businesses beat 3, sometimes reaching 7 or 8, and that many recover acquisition cost within 5 to 7 months. He called these guidelines and aimed them at SaaS. Advertisers who borrow the ratio for Meta campaigns inherit its weak point: lifetime value is a forecast of repeat buying, so a healthy-looking number can rest on customers who never come back.
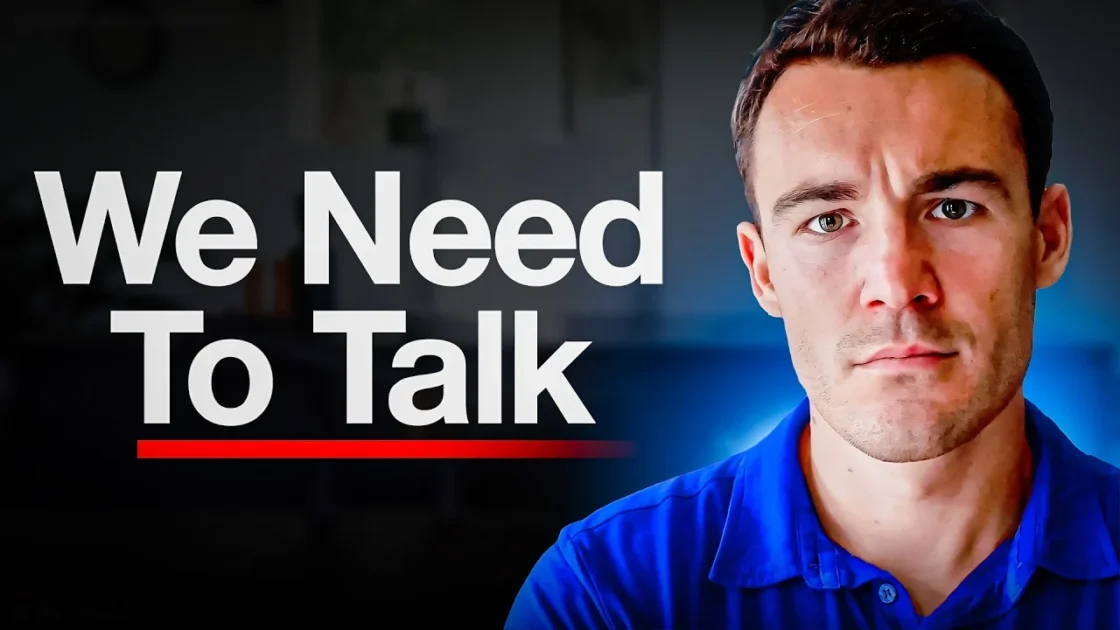
The newest popular use of it is a video published on 11 November 2026 by Ben Heath, who runs the Heath Media agency and argues that unit economics matter more than targeting, creative or landing pages. His description claims $300 million spent on ads and $1.2 billion in client revenue, both self-reported. It also carries #ad and #GooglePartner labels for a Google Ads link and points to his own course and agency.
A spreadsheet that turns a ratio of 10 into 28.8
The video builds its case on one worked example. A business with a $200 average order, five purchases per customer and a 50% gross margin earns $500 in lifetime gross profit per customer. Spend $10,000 on ads, win 200 customers, and acquisition costs $50 each, so the ratio is 10. Heath calls that “fantastic” and says the business can scale.
He then moves the inputs. Winning 250 customers for the same money lifts the ratio to 12.5. Raising the order to $300, purchases to eight and the margin to 60% produces 28.8. Halving the order to $100 but billing 23 times on a subscription gives 23. A second spreadsheet sets the break-even: a $200 order at 50% margin supports a $100 cost per purchase, and a $1,000 service at 50% margin with a 20% lead-to-client rate supports $100 per lead.
Every figure reproduces, and the method is the sensible one: gross profit rather than revenue, with overheads left out because they do not grow with each extra customer. The arithmetic is correct. What the spreadsheet cannot show is whether real customers behave like the inputs.
Benchmarks put the healthy line far below 10
Skok’s guidelines were written for subscriptions, and he stressed that many healthy firms miss them early on. His payback guideline matters as much as the ratio: profits turn thin when recovering acquisition cost stretches beyond 12 months. The video’s spreadsheets show no payback period, although Heath does note that breaking even on the first order keeps cash flow safe.
Outside SaaS the bands shift. Shopify’s January 2026 explainer calls 3:1 the sweet spot, gives ecommerce a range of 2:1 to 4:1, and says a ratio of 8:1 or higher might mean a business is spending too little on growth. Eightx, a CFO consultancy, argues that 3:1 is a software rule and compiles vertical bands, which it labels directional: 2 to 3 for apparel, 3.5 to 4.5 for pet products. Definitions also differ. Shopify defines lifetime value on revenue, yet its worked example applies the gross margin first, which is the gross-profit method the video uses.
The reading that follows is an interpretation: a ratio of 10 on gross profit is an input check, strong if the inputs hold and uninformative if they do not. The video offers 10 as an illustration, not a promise, but viewers will hold their own ratios against it, and a 10 sits above every range cited here.
Salon data shows where an average breaks
The video’s own cautionary tale is a British hair salon. The owner wanted new clients at about £6 each against a £25 haircut, and Heath says the campaign failed because it judged value on the first visit, when counting repeat visits would have given a lifetime value in the hundreds of pounds.
The principle is right, and the supporting data is thinner than the story. Phorest, a salon software supplier, reported in 2025 that 71% of new salon clients do not return after the first visit, drawing on a survey of 716 UK and Irish salon clients. The coverage reviewed does not say how the 29% retention figure was derived, and Phorest sells retention tools, so the number is an industry claim, not an audited rate.
A calculation shows why it matters. Take the video’s five purchases per customer as an illustration. If only 29% of newcomers come back, the other 71% contribute one visit each, so a salon would need each returning client to book about 14 more visits to reach an average of five (4 ÷ 0.29). Heath is right that an average across customers is the correct input. The salon figure shows how few customers may be carrying it.
Scaling moves the cost the example holds still
Every scenario in the video holds acquisition cost at $50, an average taken from the past. The next customer from a larger budget costs more, because the platform has to reach people less likely to buy. Northbeam, an attribution vendor, reported that in January 2026 the median ecommerce business raised spend while new-customer revenue fell and acquisition cost rose, whereas the top quartile cut acquisition cost and enforced ceilings on it.
Eightx, summarising Northbeam’s April 2026 panel of more than 1,000 brands, gives the sharper figures: median ad spend rose 9.6% and new-customer acquisition cost 9.7% over the year, while median revenue rose 4.4%. These are separate medians, not a matched before-and-after, and they measure about 10% more spend, not a doubling. Eightx adds that it found no published study of what doubling spend does to acquisition cost.
Applying that evidence to the video is an inference. A ratio of 10 at today’s average cost does not tell an advertiser what the ratio will be on the marginal customer. Heath’s view that such a ratio can be scaled is plausible but untested, and the top-quartile pattern, which sets CAC ceilings before raising budgets, is the method the sources actually support.
Retention carries the most weight, with a 1990 case behind it
Heath names repeat purchases as the lever most likely to move the ratio, because tripling gross margin is rare and tripling order value is hard. The oldest evidence for that view is Reichheld and Sasser’s 1990 Harvard Business Review article, which Bain summarises: retaining 5% more customers can lift profits by almost 100% in service companies. The card issuer MBNA held its annual defection rate at 5%, half the industry average, and grew profits sixteenfold. The evidence is 36 years old and drawn from services, so it supports the direction of the lever, not a figure for a Meta advertiser.
The video’s subscription example, 23 payments at half the order value, needs a reality check too. That is about two years of billing, if the payments are monthly. Shopify puts healthy monthly churn for subscriptions at 2% to 4%, and Skok treats net revenue churn above 2% a month as a sign that something is wrong. By the simple rule that lifetime equals 1 divided by churn (a calculation, not a figure from either source), 2% to 4% monthly churn means an average life of 25 to 50 months, so 23 payments is within reach of a business at benchmark churn. A subscription lifts the ratio only if customers stay.
The Google pitch sits inside the advice
Partway through, Heath recommends that Meta advertisers add Google’s Demand Gen campaigns, and the description labels the Google link #ad. Google’s help page says Demand Gen serves ads on YouTube including Shorts, Discover, Gmail, Maps and the Display Network, and claims a reach of up to 3 billion monthly users, which is Google’s own figure. It also says display campaigns are moving into Demand Gen, with new campaigns eventually possible only there.
One line on that page bears directly on the video’s maths: for target-CPA bidding, Google recommends a budget at least 10 times the target CPA. Applied to the salon’s £6 limit, that is £60, a calculation from Google’s rule (the page does not state the period).
Heath’s anecdotes are British, so the Competition and Markets Authority’s guidance for UK content creators is a natural yardstick. It says content made for payment, or promoting your own business, must be clearly labelled as advertising, and that for videos the label belongs at the beginning. The description also promotes Heath’s course and agency. The transcript contains no spoken sponsorship notice at the start and cannot show what appears on screen, so whether the video meets the guidance is not something the available material settles.
Tests an owner should run before scaling
A business owner deciding whether to scale on the strength of a ratio can test five things before trusting the number. Compute lifetime gross profit by first-purchase cohort, using only customers who have had time to reorder, so that repeat rates are measured, not assumed. Put payback months beside the ratio, since Skok’s 12-month line applies to cash as much as to profit. Track the cost of each budget step, not the average, and set a ceiling the way Northbeam’s top quartile does. Compare the result with the right band: 2 to 4 for ecommerce, nearer 3 for software, with verticals differing. Report paid-customer cost separately from the blended figure.
The video’s central claim holds: unit economics decide whether Meta ads can work, and its break-even formulas are sound starting points. What the evidence does not support is reading a 10 as safety. The uncertainty that matters most is the repeat rate of new customers, and the observable development that would settle it is a cohort table showing how many first-time buyers reorder within a year.
Author:
Jan Bielik
CEO & Founder of Webiano Digital & Marketing Agency
This article is an original analysis supported by the sources cited below
The REAL Secret to Winning with Meta Ads
The video page: title, channel, 11 November 2026 publication date, and a description carrying #ad and #GooglePartner labels, the author’s self-reported spend and revenue claims, and links to his course and agency.
SaaS Metrics 2.0 – A Guide to Measuring and Improving what Matters
David Skok’s guidelines of an LTV to CAC ratio above 3, CAC recovery in 5 to 7 months, a 12-month payback limit, and his warning on net revenue churn above 2% a month.
Zero Defections: Quality Comes to Services
Bain’s summary of the 1990 Harvard Business Review article: profits up by almost 100% from retaining 5% more customers, and MBNA’s 5% defection rate against an industry rate twice as high.
About Demand Gen campaigns – Google Ads Help
Google’s description of Demand Gen surfaces, its 3 billion monthly user claim, the migration of display campaigns, and the recommended budget of at least 10 times the target CPA.
Social media endorsements: guidance for content creators
The Competition and Markets Authority’s rules on labelling paid and own-brand content as advertising, including that video disclosure must come at the beginning.
Only 29% of new salon clients rebook, shows research
Trade coverage of Phorest’s 2025 report: 71% of new salon clients do not return, from a survey of 716 UK and Irish clients, with no explanation of how the retention rate was derived.
What Is a Good LTV to CAC Ratio? How to Calculate It (2026) – Shopify Malaysia
Shopify’s ecommerce ranges for the ratio, its warning about very high ratios, healthy churn and reorder benchmarks, and a revenue-based definition of lifetime value.
Average ecommerce LTV:CAC ratio by vertical 2026: where 3:1 is the floor, not the target | Eightx
A CFO firm’s argument that 3:1 is a software rule, with vertical bands it calls directional and a warning to compare paid and blended acquisition cost like for like.
Marginal CAC: What Really Happens When You Double Ad Spend | Eightx
Reports Northbeam’s April 2026 panel figures for spend, revenue and acquisition cost, and states that no published study maps a doubling of ad spend to a cost increase.
January 2026 Benchmarks: The Gap Between Typical And Top Performing Businesses
Northbeam’s January 2026 data: the median business paid more for weaker new-customer results, while the top quartile cut acquisition cost using ceilings and minimum creative volume.
| Citing this article? Brief excerpts are welcome. Please credit Webiano.digital, name the author where stated, and include a link to https://webiano.digital and to this original article. Full or substantial republication requires prior written permission. Read our Copyright and Content Use Policy. |
This article was prepared with the assistance of artificial intelligence tools. The content underwent expert human review, and Webiano Digital & Marketing Agency assumes editorial responsibility for its final version and publication.