
Lightning happens almost instantly. Thunder has to travel.
Table of Contents
LightningMaps.org turns that difference into the most compelling part of its map. A new strike appears as a bright point, then a circle begins expanding away from it at roughly the speed of sound. When that ring reaches your position, the thunder should reach you too. You are no longer looking at weather as a finished report. You are watching an event split into two signals: the flash that has already happened and the sound still moving through the air.
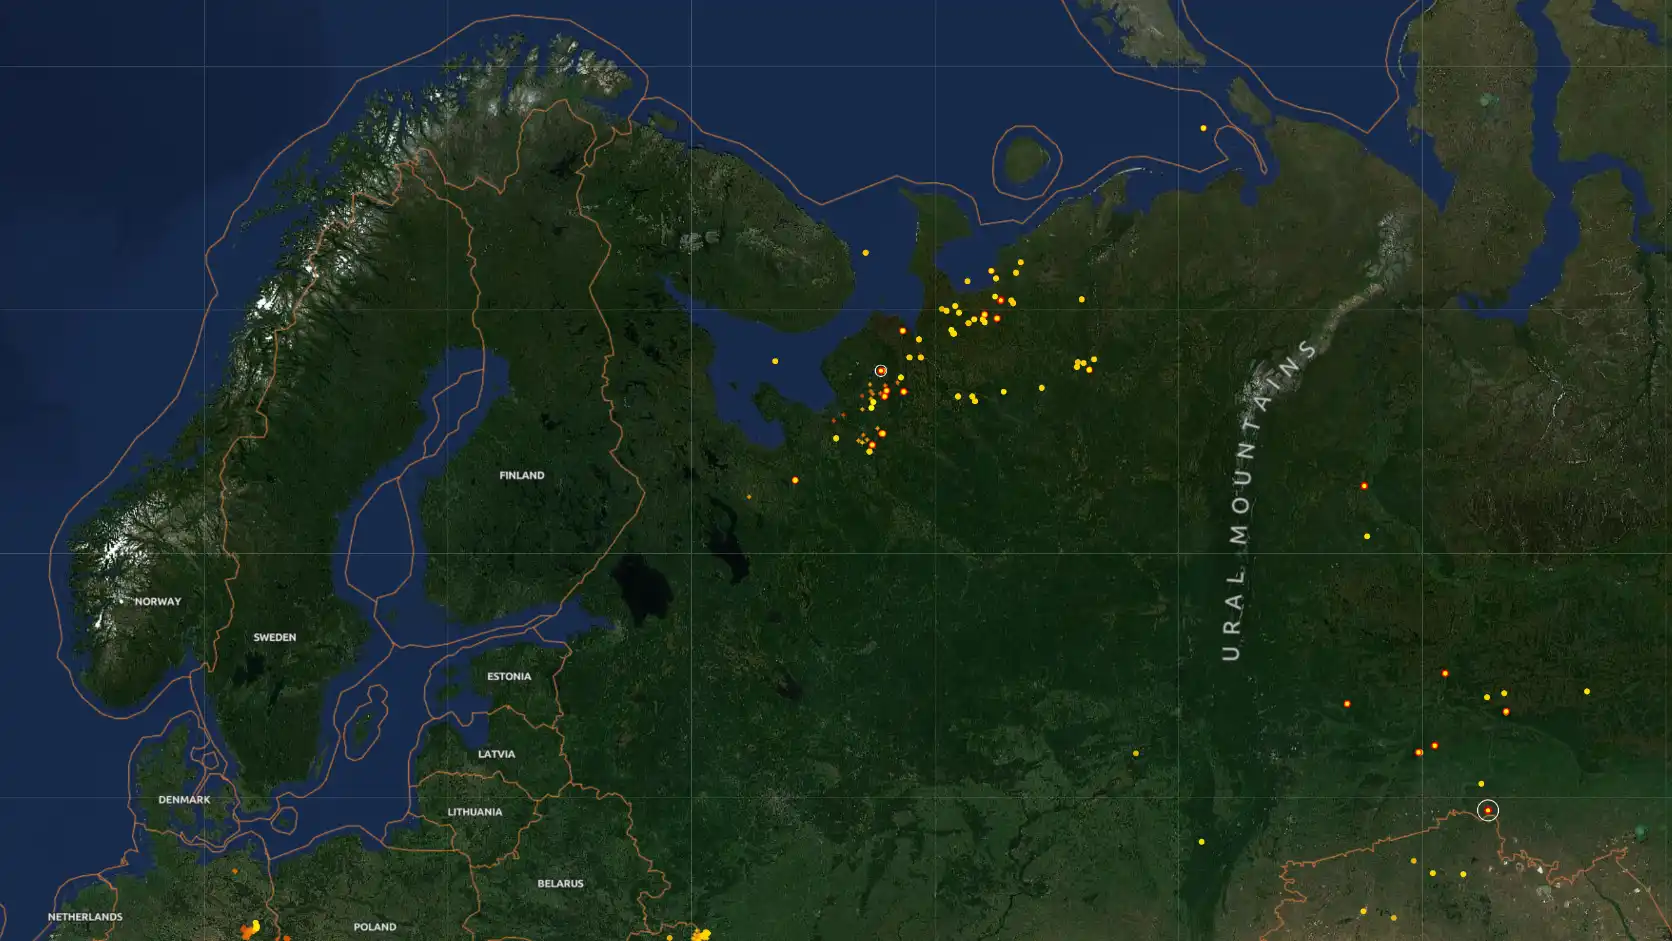
Open the site during an active storm and the map begins to feel less like a forecasting product than a live instrument. White and yellow marks flare into existence. Older strikes deepen through orange and red. Sound fronts spread outward, overlap, and disappear. A storm that looked like a vague dark mass from the window becomes a sequence of precisely placed electrical events, each with its own expanding acoustic shadow.
The experience is oddly gripping. LightningMaps.org has no dramatic presenter, no radar animation polished for television, and no stream of alarming notifications. Its appeal comes from something plainer: a global map, a volunteer detection network, and a visual idea that makes the physics of a thunderstorm immediately legible.
It also belongs to a class of websites that the commercial web rarely produces well. The project is free, non-commercial, technically serious, visibly homemade in places, and built around contributors who operate their own detection hardware. Its rough edges are part of the attraction because the site feels connected to the machinery underneath it. You are not seeing a decorative weather layer bought from an anonymous data vendor. You are looking at the public face of an international network of antennas, clocks, receivers, servers, and weather enthusiasts.
LightningMaps.org says it shows lightning across the planet in real time and provides access to maps of previous thunderstorms. The data comes from Blitzortung.org, a worldwide, community-based lightning detection project. Both services state clearly that they are intended for private and entertainment use rather than as official warning systems.
That limitation matters, but it does not diminish what makes the site worth opening. LightningMaps.org offers one of the web’s cleanest examples of invisible infrastructure becoming visible. A discharge somewhere in a cloud releases electromagnetic energy. Receivers separated by long distances register the signal at slightly different times. Servers compare those arrival times, estimate the source position, and place the result on a map. Seconds later, someone hundreds of kilometres away may be watching the mark appear.
The result is not merely useful. It is a memorable piece of internet culture: citizen science presented as a living planetary display.
The small feature that changes the whole map
Plenty of weather sites plot lightning. Some place coloured dots over radar imagery. Others count strikes within a radius, send proximity alerts, or show activity from the previous hour. LightningMaps.org becomes different when the expanding circles are switched on.
The circle is a simple visual model of thunder travelling away from the strike. Light from the discharge reaches an observer so quickly that, at human distances, it appears immediate. Sound moves vastly more slowly. The familiar gap between seeing lightning and hearing thunder is therefore a rough measure of distance. LightningMaps.org takes that childhood counting trick and builds it into the interface.
A strike appears. A ring moves outward. Your location sits still.
That is the entire idea, yet it changes the map from a record of past events into a prediction of a near-future sensation. The lightning has already happened, but the thunder associated with it may still be on the way. The map can therefore show something that ordinary radar does not: the approximate moment when an event visible in the distance should become audible where you are standing.
The effect is strongest with nearby storms. Suppose a flash appears ten or fifteen kilometres away. The ring starts at the strike point and spreads across roads, fields, towns, and neighbourhoods. You watch it approach. Then the windows tremble or a low roll reaches the room. The website and the physical world briefly synchronise. A mark on a browser becomes a sound in the air.
The timing will not always feel exact. Thunder is not a neat laboratory pulse travelling through a uniform atmosphere. Temperature, wind, terrain, buildings, the shape and length of the lightning channel, and the way sound refracts through layers of air all affect what reaches a listener. Some strikes produce sharp cracks, others long rolling sounds, and some are never clearly heard. The map’s ring should be understood as an informative approximation rather than a promise.
Still, the approximation is convincing enough to produce a small shock of recognition. The first time a ring reaches your location just before the sound arrives, the site stops feeling like a clever visualisation. It feels like an instrument connected to the sky.
That connection creates a tension absent from most weather graphics. A precipitation radar shows movement, but its colours often require interpretation. A storm cell becomes a patch of green, yellow, or red sliding across a map. LightningMaps.org deals in discrete events. Each point means that an electrical discharge was detected at a particular place and time. The map keeps adding new facts.
Because strikes are colour-coded by age, the storm also leaves a visible trail. Fresh strikes sit bright against the map. Older ones darken. A moving cell writes its route across the region, while a stationary storm builds a dense knot of overlapping marks. You can see whether electrical activity is advancing, weakening, reorganising, or repeatedly striking the same corridor.
Then the sound circles add another layer of time. Strike markers tell you what happened. Their colours tell you how long ago. The expanding rings show how the audible consequence is still travelling. The interface contains multiple clocks at once, yet it remains understandable without a tutorial.
That is a rare design achievement. The web is full of maps overloaded with filters, panels, legends, forecasts, warnings, advertisements, and competing data layers. LightningMaps.org can also become busy, especially during widespread storms, but its central interaction remains unusually direct. You look for the newest flash, notice where it landed, and follow the circle.
The site is especially striking when zoomed to a familiar area. A global view communicates scale, but local geography supplies meaning. A strike beside a town you know feels different from one in an anonymous grid square. A cluster along a motorway, coastline, mountain range, or city edge immediately invites interpretation. The map borrows emotional weight from places already stored in your mind.
This is why LightningMaps.org can hold attention even when the storm is far away. Watching lightning over the Mediterranean, central Africa, the Gulf of Mexico, or Southeast Asia is not the same as watching rain move across a generic weather layer. The individual flashes give the atmosphere a pulse. You start noticing where night-time storms are active, where coastlines concentrate activity, and how separate storm systems flicker across an entire continent.
The map also rewards waiting. Most websites are built to minimise pauses. They load a page, deliver a result, and encourage the next click. LightningMaps.org becomes better when left open. Its subject supplies its own rhythm. Nothing happens for several seconds. Then a point appears. Another follows. A cluster forms. Rings pass through one another. The page asks for attention without demanding constant interaction.
That makes it unusually suitable as a second-screen website. During a storm, it can sit beside a window or on an old tablet. During quiet weather, a zoomed-out world view becomes a kind of ambient planetary monitor. It is not calming in the usual polished-dashboard sense. It is calming because the site allows a real process to continue without packaging every moment as content.
The thunder-delay feature also reveals something important about good visual explanation. It does not begin with a paragraph about acoustic propagation. It begins with motion. The concept is understood through watching. The explanation can come later, but the map earns curiosity first.
That sequence—experience before documentation—is one reason the site is so shareable. You can send someone the link with a single instruction: wait for a strike near you and watch the circle. No long setup is required. The site produces its own demonstration whenever the weather cooperates.
A worldwide instrument assembled by strangers
LightningMaps.org is the visible layer. Blitzortung.org is the network that makes the map possible.
The name comes from German: “Blitz” means lightning, while “Ortung” refers to locating or direction finding. The project describes itself as a worldwide, non-commercial, low-cost, community-based lightning detection and location network. Contributors operate receiver stations, which send measurements over the internet to regional processing servers.
That organisational model is more interesting than a conventional sensor network purchased and installed by one company. Blitzortung.org is distributed not only in a technical sense but in a social one. Its coverage depends on people deciding to buy or assemble equipment, install antennas, maintain a receiver, provide connectivity, and contribute measurements.
The project’s documentation makes clear that participation is not equivalent to ordering a finished consumer gadget. Prospective station operators generally assemble the detector themselves from specified parts or kits. The official FAQ says complete assembled stations are not offered directly and points interested builders toward the project community and forum.
That requirement filters the contributor base. Running a station asks for curiosity, patience, some technical confidence, and a willingness to keep infrastructure alive without turning it into a business. The network therefore has the character of a serious hobbyist project: capable enough to operate across continents, yet rooted in individual workshops, roofs, attics, gardens, and home internet connections.
The receivers listen for radio-frequency energy produced by lightning discharges. A discharge sends electromagnetic signals across a broad frequency range. Blitzortung stations use very-low-frequency and low-frequency reception equipment, precise timing, and known station coordinates. Each station records when it received a lightning impulse and sends that information to the processing system.
One receiver cannot reliably place a strike on the map. The location emerges from comparison. If several stations detect the same signal, the system can examine the tiny differences in arrival time. A station closer to the discharge receives the signal slightly earlier than one farther away. With reports from enough suitably positioned stations, the server can estimate where the signal originated.
The underlying method is known as Time of Arrival. Blitzortung’s technical explanation describes the location process through hyperbolic curves: each time difference between a pair of stations constrains the possible source to a curve, and the intersection of several constraints gives an estimated location. The documentation notes that at least four appropriately arranged sites are needed to define a unique position consistently.
The mathematics is substantial, but the public result is wonderfully ordinary: a dot appears on a map.
That dot contains the work of antennas receiving faint electromagnetic impulses, GPS-based timing, internet transmission, signal matching, geometric calculation, software filtering, map rendering, and community maintenance. None of this complexity is visible during casual use. LightningMaps.org hides the machinery without erasing its presence. The link to Blitzortung.org, the detector displays, the technical pages, and the project’s old-web appearance leave enough seams exposed for a curious visitor to follow.
Those seams matter. Many digital services present themselves as magical surfaces. Data arrives from nowhere. Recommendations simply exist. Maps fill themselves. LightningMaps.org points back toward physical receivers and identifiable contributors. The site encourages the user to ask how it knows.
The answer is also a compact lesson in measurement. The stations do not photograph lightning. They do not need a clear line of sight to every flash. They detect the electromagnetic signature of a discharge, timestamp it, and contribute that observation to a shared calculation. The map is an inference built from many partial observations.
That distinction becomes clearer when looking at station coverage. The network is stronger where more receivers operate in useful geographic arrangements. Coverage and precision vary across regions. A dense network gives the processing system more measurements and more favourable geometry; sparse areas provide fewer opportunities to locate weaker events accurately. Blitzortung’s own material stresses that accuracy and detection rates differ with station density and local conditions.
The public map can display detector locations, making the network itself visible. Clusters of stations reveal where participation is concentrated, while empty spaces expose the physical limits of a “global” service. The word global is true in the broad sense—the project spans multiple continents—but not every place is observed equally.
That unevenness makes the project more honest, not less interesting. Commercial interfaces often flatten differences in data quality into one confident visual layer. LightningMaps.org is easier to understand as a living, incomplete system. Its gaps tell you something about the geography of participation, connectivity, technical hobbies, and available resources.
A receiver may sit in a suburban attic in Germany, on a rural property in Australia, near a coastal city in the United States, or in a region where one new station materially improves coverage. Each operator contributes a stream of timings that becomes useful only when combined with those from others. The network works because individual stations are limited.
There is a quiet social elegance in that arrangement. No single contributor sees the whole sky. No single antenna has enough information. The useful result appears only after observations meet on a shared server. Blitzortung is collaborative not as a slogan but as a property of the measurement method.
The map’s immediacy can make this easy to miss. A strike appears so quickly that the process feels automatic. Yet the system exists because strangers built receivers to a common design, synchronised their equipment, accepted shared rules, and kept sending data. LightningMaps.org compresses international cooperation into a flashing point.
What happens between flash and map
| Stage | What is happening |
|---|---|
| Discharge | Lightning emits a strong electromagnetic impulse |
| Reception | Multiple volunteer stations detect the signal |
| Timing | Each station records a precise arrival time |
| Location | Servers compare timings and estimate the source |
| Display | The strike appears on LightningMaps.org |
| Thunder model | A circle expands at an approximate sound speed |
The table looks linear, but several stages happen almost at once. Radio waves travel close to the speed of light, timing differences are measured in tiny fractions of a second, and the results are transmitted and processed quickly enough to create the impression of a live planetary instrument. The thunder ring then shifts the viewer into a much slower timescale: sound crawling across the map after the electromagnetic event has already been detected.
The contrast between those speeds is the conceptual heart of the website. The network receives the lightning signal long before a nearby human hears the thunder. LightningMaps.org uses that head start to visualise the sound’s expected journey.
The same contrast explains why the site can feel predictive without forecasting lightning. It does not know where the next discharge will occur. It knows where one has just occurred, and it estimates where its sound front should be now. It predicts the arrival of a consequence, not the event itself.
That is a modest claim, but a powerful one. Digital products often promise to anticipate complicated futures using opaque models. LightningMaps.org performs a much simpler act with visible logic. A point happened there. Sound moves outward. You are here. The ring between those places is understandable at a glance.
The pleasure of watching raw weather become legible
Weather websites usually pursue one of two goals. They either tell you what to do—carry an umbrella, delay a trip, seek shelter—or explain what the atmosphere is doing through maps and charts. LightningMaps.org sits between those modes without fully belonging to either.
It is useful, but usefulness does not exhaust it. People open the site because a storm is near, because they saw a flash, because they want to judge whether a cell is approaching, or because they are curious about activity elsewhere. Once open, the map encourages a more attentive form of watching.
A flash outside gives you incomplete information. It may be close or distant. It may belong to a storm moving toward you or away. It may have occurred behind a building or within a cloud. LightningMaps.org supplies a candidate location and places it among other recent events. The isolated sensation gains spatial context.
The relationship works in reverse too. A strike on the map prepares you to notice the world. You may turn toward the window, listen for thunder, or look for a flash from the next discharge. The screen does not replace observation; it sharpens it.
That is unusual. Many information products encourage users to trust the interface instead of their senses. LightningMaps.org is most satisfying when checked against direct experience. The map says a strike occurred eight kilometres west. The sky in that direction glows. A ring approaches. Thunder follows. Every match between page and environment builds confidence through verification rather than branding.
When the match is imperfect, the discrepancy can be interesting. Perhaps the strike was too far away to hear. Perhaps wind or terrain altered the sound. Perhaps the discharge was inside a cloud, the location estimate shifted, or the visible flash belonged to another event. The site turns weather into a small observational puzzle.
Dense storms produce a different pleasure. During intense electrical activity, the display becomes almost musical. Points arrive in bursts. Rings overlap. Older marks deepen in colour while fresh ones appear on top. The storm writes rhythm and direction into the map.
One cell may advance as a narrow line, repeatedly flashing along its leading edge. Another may pulse over the same area for an hour. Separate clusters may merge. A quiet patch may suddenly ignite. Even without meteorological training, a viewer starts recognising behaviour. Repeated observation teaches through pattern rather than instruction.
The colour scale is central to this learning. Freshness is represented spatially and chromatically. White or pale marks show the newest activity, while older strikes move through warmer, darker tones. A storm’s recent core stands out against its fading history. Time becomes a trail.
This is a better fit for lightning than a conventional playback bar. Rainfall is continuous enough to animate as a moving field. Lightning is granular. Each strike has a specific timestamp and location. The ageing colours preserve those points while preventing the newest activity from getting lost. The visual grammar matches the phenomenon.
At a continental scale, the map reveals another character. Individual strikes matter less, while storm systems become constellations. The eye moves toward concentrations: central Africa flashing through the evening, tropical storms following coastlines, summer convection scattered across Europe, or long electrical bands crossing North America. The globe appears less like a static atlas than a nervous system firing in patches.
That metaphor should not be pushed too far, but the visual resemblance explains part of the fascination. Lightning is brief, distributed, and electrically expressive. A real-time map lets distant events coexist on one surface. The planet seems active in a way ordinary satellite imagery rarely captures.
Night and day also shape the experience. The site itself is not dependent on darkness, but human attention is. A distant storm at night makes each flash visible through curtains and clouds. The map adds location and timing. During daytime, when lightning may be harder to see, the strike feed can reveal how electrically active an apparently grey sky has become. The website extends perception differently depending on the conditions.
Sound is equally variable. Close strikes can produce a violent crack. Distant ones become long, low rolls. Some thunder seems to travel along the sky; some arrives as several separate pulses. A single map point cannot reproduce the full geometry of a lightning channel or the complicated path of its sound. The ring is deliberately simpler than the phenomenon.
That simplification is good design. A scientifically complete representation of thunder propagation would require atmospheric profiles, terrain, wind fields, source geometry, and far more computation and explanation. It might also be less useful to an ordinary visitor. LightningMaps.org chooses a model simple enough to watch.
The best internet tools often make this choice well. They do not attempt to represent everything. They identify one relationship worth seeing and build the experience around it. Here, the relationship is between strike position, elapsed time, distance, and the delayed arrival of sound. The site’s strongest idea fits in a single expanding circle.
There is another reason the experience feels raw: it lacks the emotional scripting common to commercial weather media. No presenter calls a storm “monstrous.” No thumbnail promises terrifying footage. No automated copy declares every cluster dangerous. The data appears with relatively little editorial theatre.
That restraint leaves room for the viewer’s own reaction. A storm nearby may be worrying. A distant one may be beautiful. A vast tropical outbreak may be scientifically interesting. A single isolated strike may be surprising. LightningMaps.org does not insist on one emotional interpretation.
The absence of manufactured urgency is especially noticeable because lightning is genuinely hazardous. A site could easily exploit that danger for clicks. LightningMaps.org instead places a plain warning around its own limitations: the network is not an official information service, and its data is for private or entertainment use.
That statement is both a legal boundary and a design clue. This is an observational project, not an emergency authority. It may deepen your awareness of a storm, but it should not replace official alerts, forecasts, local instructions, or basic lightning safety.
The distinction preserves what the site does best. It gives people access to a fascinating stream of live measurements without pretending those measurements answer every practical question. The map is compelling because it is specific about one thing: detected electrical activity.
An interface that still feels like the old useful web
LightningMaps.org does not look like a venture-funded weather startup. That is a compliment.
The interface has the visual density and occasional awkwardness of a site that grew around a working system. Controls, region options, archives, statistics, detector views, language choices, and project links coexist without being reorganised into a polished marketing funnel. The map is the product, the demonstration, and the homepage.
There is little effort to introduce the service through animated slogans or oversized lifestyle photography. You arrive and see lightning. The website trusts the phenomenon to explain the value.
This directness belongs to an older tradition of specialist web projects. Such sites often begin as tools for participants, enthusiasts, or researchers, then become useful to a much larger public. Their interfaces carry traces of that origin. Features are named according to what they do. Documentation sits nearby. Statistics remain visible. The site feels operated rather than “launched.”
That distinction affects trust. A highly polished weather app may be easier to use, but it can hide its sources behind branding. LightningMaps.org names Blitzortung.org prominently and links back to the network. The project documentation explains the detection method, receiver hardware, station operation, data limitations, and participation model.
A curious visitor can move from spectacle to mechanism without leaving the project’s ecosystem. Watch a strike, inspect the detector network, read about Time of Arrival calculations, browse hardware documentation, and discover that people build these receivers themselves. The rabbit hole is unusually coherent.
The statistics pages add another dimension. Regional pages show current activity and historical counts, while archived maps make it possible to revisit previous storms. Some regional statistics are calculated over fixed intervals rather than updated with every single live marker, and the site exposes those timings instead of smoothing them away.
This transparency reinforces the sense of infrastructure. You see timestamps, update cycles, station information, and data boundaries. The service behaves less like a finished media object than a window into a running network.
The old-web character also appears in the project’s language. It repeatedly calls itself non-commercial and community based. Restrictions on commercial data use are stated directly. The purpose is not disguised as a growth strategy. The map exists because contributors want a lightning network to exist.
That motivation is refreshing in a browser crowded with products engineered around subscription conversion, advertising inventory, or data capture. LightningMaps.org does not ask the visitor to create a personality profile before showing a storm. It does not place the core feature behind a trial. The interesting thing is simply available.
Free access should not be confused with costless operation. Receivers, components, hosting, bandwidth, maintenance, software, documentation, moderation, and volunteer time all have real costs. The absence of a conventional commercial layer means those burdens are distributed through participation and project stewardship rather than hidden inside a corporate business model. The site’s simplicity rests on sustained work.
Its design is therefore best judged by fitness rather than fashion. Does the map load? Are strikes distinguishable? Can the viewer understand freshness? Can they zoom to a region and follow activity? Can they find the network behind the display? On those terms, LightningMaps.org succeeds.
There are frustrations. Controls may not behave exactly as someone accustomed to modern mobile apps expects. The number of views and regional pages can be confusing. A first-time visitor may need to explore before finding the preferred combination of layers. Heavy strike activity can become visually crowded. The site sometimes asks the user to adapt to it.
Yet those rough edges rarely undermine the central pleasure. The moment a strike appears and its circle begins moving, interface criticism becomes secondary. The underlying idea is strong enough to survive imperfect presentation.
This is a useful lesson for product designers. A memorable interaction does not always require visual novelty. Maps, points, rings, colour scales, and timestamps are familiar components. LightningMaps.org combines them around a real physical delay. The originality lies in choosing the right relationship to display.
The site also avoids a common mapping mistake: treating every layer as equally important. Despite its options, the newest strikes remain the visual centre. The eye understands what has changed. Live data is given visual priority over the base map.
Compare that with overloaded smart-city dashboards, where traffic, air quality, weather, alerts, cameras, infrastructure, and analytics compete for attention. Those products may contain more information but produce less understanding. LightningMaps.org stays close to one phenomenon. Its narrowness gives it clarity.
The project’s technical vocabulary adds texture rather than becoming a barrier. Terms such as receivers, stations, strikes, detectors, and Time of Arrival invite further reading, but the live map works without mastering them. A casual visitor and a radio enthusiast can use the same page at different depths.
That layered accessibility is difficult to design deliberately. Simplify too much and the system becomes a toy. Expose too much and the public interface becomes an operator console. LightningMaps.org lands in a productive middle. It offers immediate spectacle while leaving the engineering door open.
The result feels unusually honest about where digital experiences come from. A real-time map is not merely a front end. It is the final stage of a chain stretching from atmospheric electricity to physical antennas, precise clocks, contributor networks, servers, algorithms, and browsers. The page makes that chain discoverable.
What the map reveals about internet culture
LightningMaps.org is easy to describe as a weather tool, but that label misses its cultural interest.
The project is evidence that the internet can still coordinate serious, public-facing infrastructure without turning every participant into a customer. Contributors build and run stations. Measurements travel across borders. Shared software converts those measurements into a global view. Anyone can open the map.
This model sits somewhere between amateur radio, citizen science, open technical communities, and the service-oriented web. It does not fit neatly into the language of social platforms or software businesses. Its community is organised around maintaining a capability rather than maintaining attention.
That capability is specific: locate lightning through distributed radio reception. Specificity protects the project from the vagueness that weakens many community platforms. Participants know what counts as contribution. A receiver either sends useful timing data or it does not. Coverage either improves or remains sparse. The network’s purpose is measurable.
The website gives non-participants a role too. Most visitors will never assemble a detector, yet they can observe the result and become more curious about weather, radio, timing, mapping, or collaborative infrastructure. Public visibility turns an engineering network into a shared cultural object.
This matters because much scientific infrastructure is invisible to ordinary people. Sensors gather data, institutions process it, and conclusions appear in reports or apps. LightningMaps.org collapses the distance between instrument and audience. The public sees the measurement stream while the storm is still happening.
The map also counters the idea that citizen science must look educational in a formal sense. There are no compulsory lessons, badges, classroom worksheets, or quizzes on the main screen. Learning emerges from use. The visitor notices that lightning can be detected by radio, that timing differences reveal location, and that sound lags behind light.
Curiosity is not announced as an objective. It is produced by the interface.
The project’s international scale gives this curiosity a political dimension, though not a partisan one. Weather ignores national borders, while sensor coverage does not. A storm crosses from one country to another without changing its physical identity, but the density of stations may change sharply. The map displays one atmosphere over an uneven human network.
That unevenness prompts questions. Why are receivers dense in one region and scarce in another? Is the difference caused by population, disposable income, technical culture, shipping access, internet reliability, project awareness, language, regulation, or local interest? A detector map quietly becomes a map of participation.
The same pattern appears across the volunteer internet. OpenStreetMap coverage reflects where people map. Community radio archives reflect where someone records. Public webcams show where someone maintains a camera. Distributed computing projects reflect where participants donate hardware time. Volunteer systems inherit the geography of their volunteers.
LightningMaps.org does not solve that limitation, but it makes the benefit of participation obvious. Add a station in a poorly covered region and the network gains another point of observation. The effect is not symbolic. A physical device can improve what the map knows.
This direct link between contribution and public capability is rare on contemporary platforms. Uploading content usually feeds an opaque recommendation system or advertising model. Operating a Blitzortung receiver contributes to a defined technical process. The participant can understand the path from input to result.
There is also a pleasing mismatch between the scale of the network and the modesty of its presentation. A worldwide real-time lightning location system sounds like the product of a major scientific agency or multinational weather company. Here it appears through a community project whose documentation discusses self-assembled detectors and whose public pages retain the character of specialist web software. The infrastructure is grander than the branding.
That reversal makes discovery satisfying. The visitor expects a useful map and finds an international measurement network underneath. The deeper the click, the stranger and more impressive the project becomes.
The web once contained many experiences like this: narrow projects operated by people obsessed with a subject, openly linked to their methods, built for function first, and gradually discovered by outsiders. Some survive. Others were absorbed into platforms, abandoned, or buried by search results dominated by commercial summaries. LightningMaps.org feels like a surviving specimen of the web as a collection of instruments.
Calling it “old web” should not imply nostalgia for poor usability or outdated security. The important quality is structural. The project has a strong domain, a clear purpose, visible sources, specialist documentation, and a reason to exist beyond content production. It is a destination, not a page assembled to capture a keyword.
That difference can be felt within seconds. Search-driven sites often delay the useful part beneath introductions, comparison tables, affiliate links, and repeated calls to action. LightningMaps.org begins with the live object. The storm is already there.
Its appeal also resists infinite scrolling. There is no endless feed of lightning selected to maximise engagement. The amount of activity is determined by the atmosphere. Some moments are busy. Others are quiet. Nature controls the posting schedule.
This makes the site strangely resistant to the dominant grammar of social media. Strikes are not liked, ranked, commented on, or personalised. A discharge appears because it occurred, not because an algorithm predicts you will react. The feed is chronological because physics is chronological.
The map can still become compulsive, especially during severe weather, but the compulsion has a different texture. You are waiting for reality to produce another event. Attention remains attached to something outside the platform.
That outward orientation is one reason the site leaves a stronger memory than many technically superior weather apps. The best moment happens when the browser and the sky agree. The page points beyond itself toward a flash, a sound, a direction, or a storm line. Its success is measured by how clearly it reconnects you to the physical event.
Who will keep this tab open
LightningMaps.org is not only for weather enthusiasts, though they are the obvious audience.
Anyone who enjoys watching systems operate in real time will understand the attraction. Flight trackers, ship maps, earthquake feeds, radio receivers, satellite passes, network monitors, and live public-transport diagrams share a similar appeal. They turn large, invisible processes into moving evidence.
The site is particularly good for people who live in storm-prone areas. During active weather, it gives a quick picture of where electrical activity is concentrated and whether recent strikes are appearing closer or farther away. The map can support awareness, provided it is not mistaken for an official safety service.
Photographers may use it to understand where storms are electrically active, though field decisions should still follow expert forecasts and lightning safety practices. Amateur radio operators will recognise the relevance of atmospheric radio noise and timing. Teachers can use the map to demonstrate the delay between light and sound. The project connects several interests without being designed as a generic educational portal.
Parents may find that the expanding rings answer a child’s question better than a verbal explanation. A flash appears. The circle travels. Thunder arrives later. The map turns “why do we hear it afterwards?” into an observable event.
Designers should study it for another reason. LightningMaps.org shows how a tiny conceptual feature can elevate a conventional data display. Remove the sound circles and the site remains a useful strike map. Add them and it becomes memorable. The feature does not merely add information; it changes the story the interface tells.
Data visualisation practitioners may appreciate the handling of event age. Fresh points remain distinct while older activity forms a fading record. The map communicates sequence without requiring playback. It lets time accumulate spatially.
Developers working on real-time systems can also learn from the site’s perceived immediacy. The page does not need every event to appear with zero delay for the experience to feel live. It needs updates close enough to the physical event that the user can connect them. “Real time” here is experiential as well as technical.
Citizen-science organisers may find the project even more instructive. Blitzortung gives contributors a concrete role, standardised hardware, shared processing, visible results, and a public outcome. Participation is tied to infrastructure rather than occasional surveys or symbolic membership.
The site also suits idle exploration. Zoom out and follow storms on another continent. Check where lightning is active at local midnight. Compare coastal and inland patterns. Look at detector distribution. Browse archived maps after a notable storm. The project rewards wandering because every layer points back to a real event or component.
There is a mild voyeuristic feeling in watching distant weather, though not in a personal sense. You see a storm flashing over places where millions of lives continue beneath it. Roads, homes, farms, airports, mountains, and coastlines sit under clusters of points. The map makes faraway atmosphere present without pretending to tell the human stories below.
That restraint separates it from disaster media. A lightning cluster may accompany dangerous conditions, but the map does not convert those conditions into spectacle through footage of damage or frightened people. It shows the physical signal and stops there.
For travellers, the map is interesting before and during a journey, but it should remain secondary to official forecasts and alerts. Its live strikes may show where thunderstorms are occurring, while its archives can reveal previous activity. It is an observational companion, not a route-planning authority.
For people frightened by storms, the effect may vary. Seeing exact strike positions can reduce uncertainty, but watching nearby activity multiply may increase anxiety. The site does not soften the data. It gives shape to the storm, which can feel reassuring or intense depending on the viewer.
That emotional ambiguity is part of its honesty. Lightning is beautiful, scientifically rich, noisy, dangerous, and difficult to ignore. A good map should not force it into one category. LightningMaps.org allows fascination and caution to coexist.
The project deserves an especially strong recommendation to anyone who collects unusual websites. It has the qualities that make a web discovery worth sharing: an immediate hook, a real function, surprising infrastructure, a distinctive interaction, and a deeper story available through exploration. It passes the best test for an internet gem: describing it makes people want to open it.
“Real-time lightning map” is enough to earn a click. “The thunder delay is built into the map” is what makes the tab stay open.
Things worth knowing before you rely on it
The site presents recently detected strikes with frequent updates, creating a near-real-time view rather than a delayed historical summary. The project itself uses the term real time, and its public maps are built from ongoing Blitzortung station reports. Exact latency may vary because detection, transmission, processing, and browser updates all take time.For ordinary observation, the experience is close enough to connect a new map point with a flash or approaching thunder. It should not be interpreted as an instantaneous, guaranteed record of every discharge.
No. Detection depends on signal strength, station coverage, interference, network geometry, and processing conditions. Blitzortung’s documentation says the network probably does not register every stroke and explains that areas with sparse station coverage tend to detect mainly stronger discharges.A blank patch therefore does not prove that no lightning occurred. Likewise, a plotted point remains an estimated location derived from sensor timings. The map is a measurement system with limits, not a complete inventory of the atmosphere.
Accuracy varies by region and by event. LightningMaps.org has stated that precision can sometimes be better than one kilometre, while Blitzortung’s technical material is more cautious and notes that station density, geometry, timing, signal propagation, and other factors affect the result.Dense coverage usually gives the system more information to work with. Sparse coverage produces greater uncertainty and lower detection rates. A strike marker should be read as a strong estimate, not a survey pin.
No. The circles model the outward travel of sound from a detected strike. The detection network receives electromagnetic radio signals from lightning, not the thunder sound heard by a listener. Stations timestamp those radio impulses, and the website uses the strike position and elapsed time to represent the approximate sound front.Real thunder propagation is more complicated than a perfect expanding ring. Atmospheric conditions, terrain, wind, buildings, and lightning-channel geometry affect when and how the sound arrives. The circle is best understood as an elegant approximation.
A lightning discharge is not always a single compact sound source. The visible channel may extend for kilometres, and sound from different parts of it reaches the listener at different times. Echoes, refraction, terrain, and atmospheric layers can lengthen the audible roll.The map reduces this complex geometry to a point and a travelling radius. It predicts the rough arrival window, not the full duration or character of the thunder.
It should not replace an official weather service, emergency alert, or established lightning-safety guidance. Blitzortung.org and LightningMaps.org explicitly state that the system is intended for private and entertainment purposes and is not an official information service.A nearby strike on the map is reason to take conditions seriously, but absence of a marker is not proof of safety. When thunder is audible, treat lightning as close enough to matter and follow local official advice.
The network is built around participant-operated receiving stations, but joining involves real hardware and technical work. The project documentation explains that contributors typically assemble their own detectors rather than purchasing a complete plug-and-play station directly from Blitzortung.Potential participants should consult current official documentation, hardware availability, coverage needs, and project rules. Operating a station is closer to joining a technical network than installing a consumer weather sensor.
LightningMaps.org provides access to maps of former thunderstorms as well as current activity. Regional pages, archives, statistics, and age-coloured strike displays allow visitors to examine more than the newest event.Access conditions and detail vary across the public pages. The project places restrictions on commercial use and reserves fuller raw-data access for participating contributors under its rules. The public site is made for viewing and exploration rather than unrestricted commercial extraction.
It closes the gap between abstract data and bodily experience. A strike point appears on a familiar map. A circle approaches your location. Thunder arrives through the walls. Few websites produce such a clean sequence from remote sensing to direct confirmation.The experience is partly informational and partly theatrical, but the theatre comes from physics rather than presentation. The sky supplies the special effects.LightningMaps.org is worth bookmarking before the next storm, not because it promises perfect knowledge, but because it gives lightning a readable form. It shows the strike, preserves its recent history, and visualises the delayed sound moving across the ground.
The finest detail is also the simplest: the flash is already over, but the thunder is still travelling toward you.
Author:
Jan Bielik
CEO & Founder of Webiano Digital & Marketing Agency
This article is an original analysis supported by the sources cited below
LightningMaps.org real-time lightning map
The main public map for viewing recently detected lightning strikes, thunder sound fronts, regional activity, and historical storm maps.
About LightningMaps.org
The official explanation of LightningMaps.org as an additional public service connected to the Blitzortung.org project.
Blitzortung.org and LightningMaps.org documentation
The project’s official documentation covering its non-commercial purpose, community structure, hardware, station operation, and technical background.
Lightning detection method
The official description of lightning radio emissions and the Time of Arrival method used to estimate discharge locations.
Blitzortung.org
The main website of the worldwide community-operated lightning detection and location network that supplies the underlying strike data.
LightningMaps.org regional information
A project page explaining participation, intended data use, network limitations, and the possible precision of strike locations.
LightningMaps.org regional statistics
A public example of the project’s current-activity statistics, update information, and historical strike counts.
| Citing this article? Brief excerpts are welcome. Please credit Webiano.digital, name the author where stated, and include a link to https://webiano.digital and to this original article. Full or substantial republication requires prior written permission. Read our Copyright and Content Use Policy. |
This article was prepared with the assistance of artificial intelligence tools. The content underwent expert human review, and Webiano Digital & Marketing Agency assumes editorial responsibility for its final version and publication.