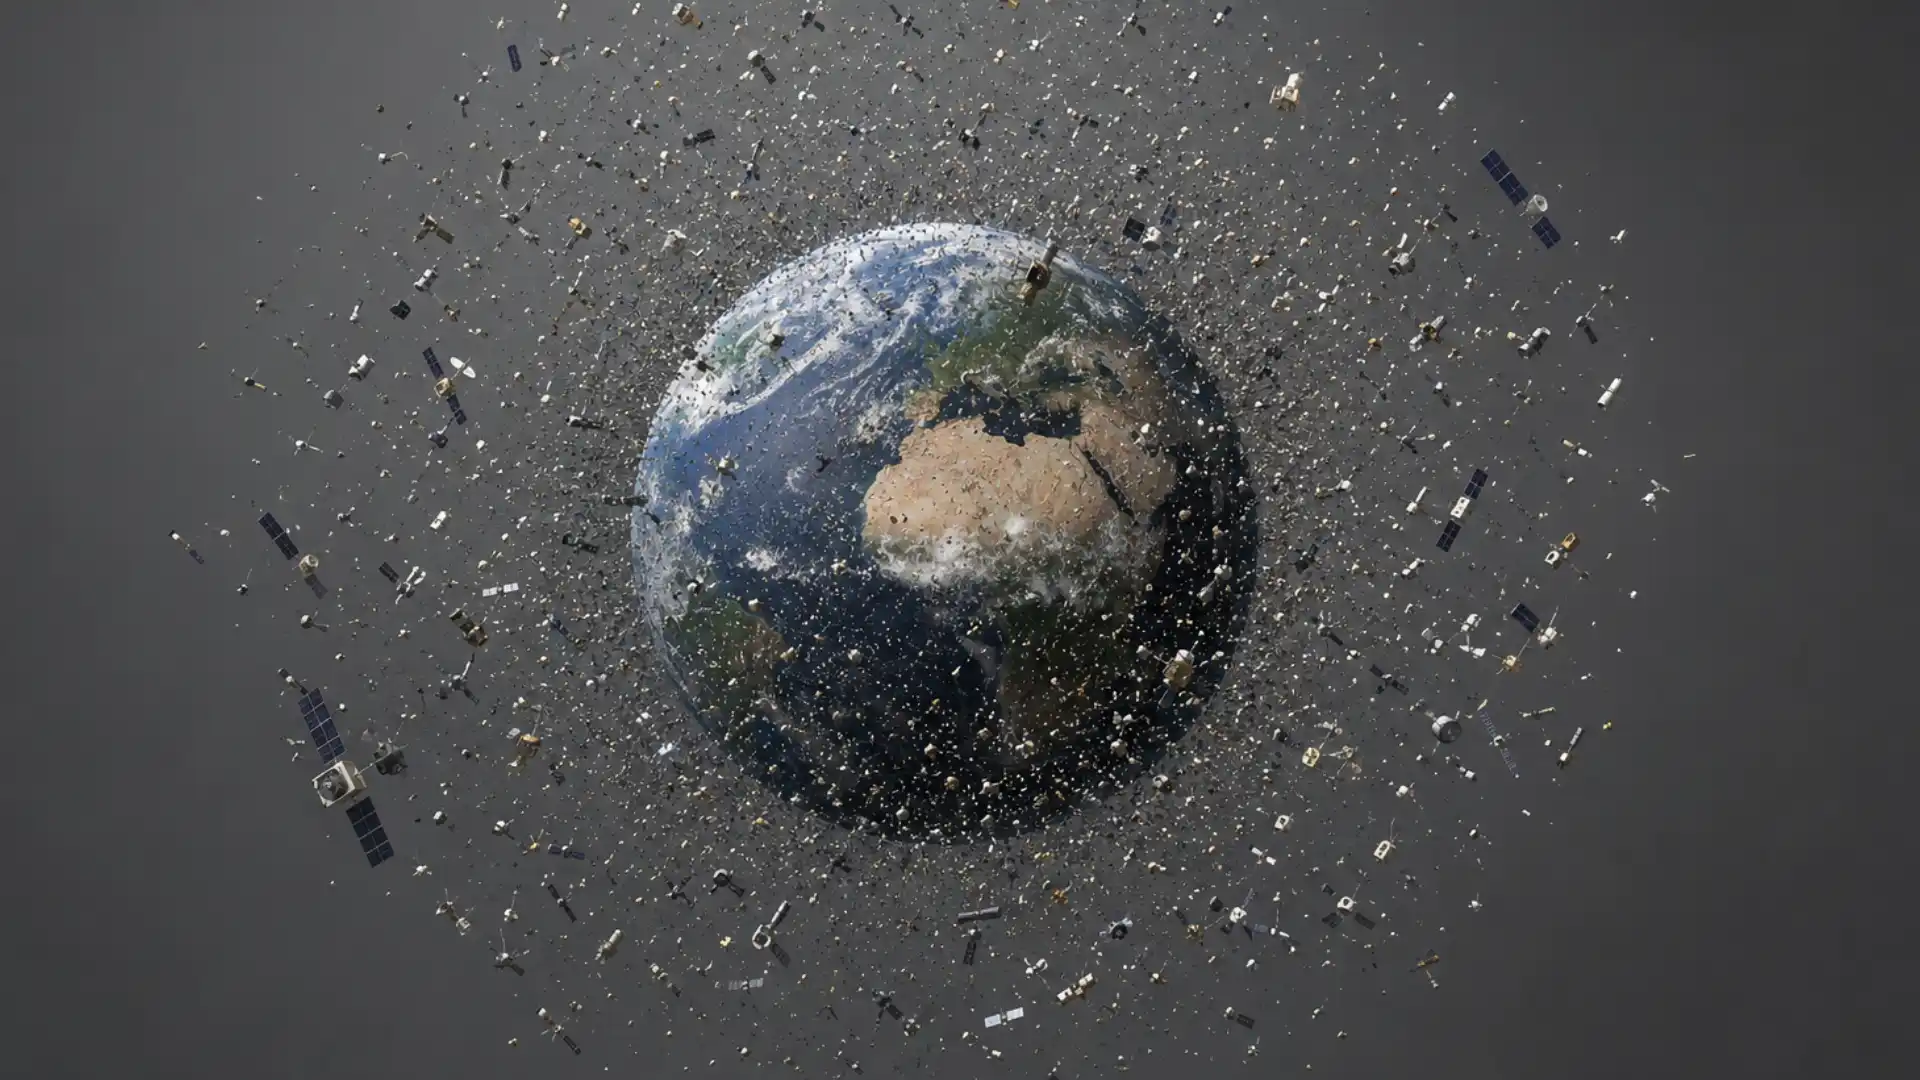
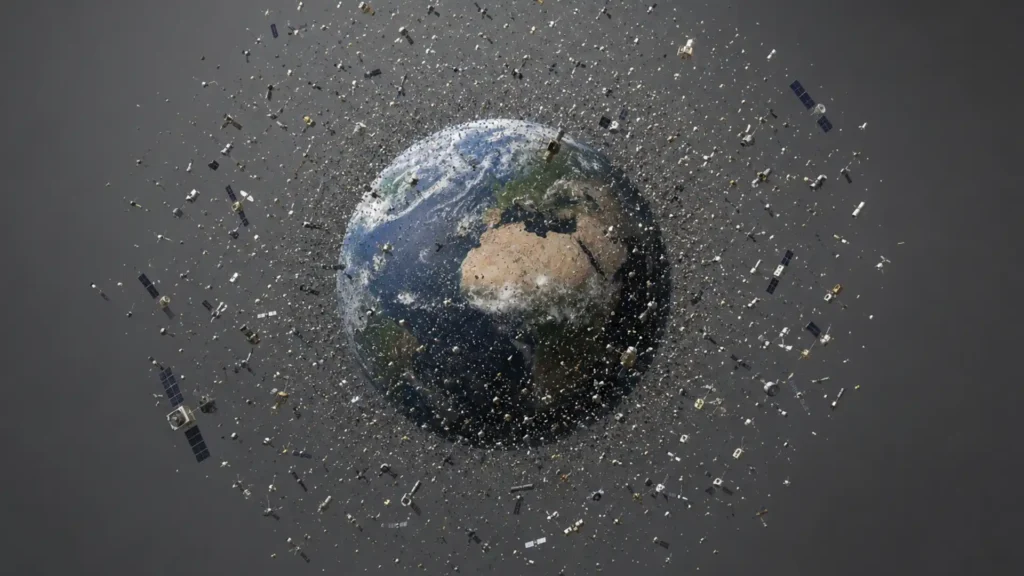
Open Stuff in Space and Earth stops looking like the clean blue marble from a schoolbook. Within seconds, the black around it fills with moving marks: active satellites, dead rocket stages, fragments from old breakups, all crossing the same near-Earth neighbourhood. The site does not need dramatic copy to make its point. Orbit is not empty. It is busy, useful, and increasingly crowded with things nobody can simply bring back down.
Table of Contents
For most of us, orbit exists as a vague upper floor of reality. We know there are weather satellites, GPS, the International Space Station, perhaps Starlink because it occasionally crosses the night sky like a crooked string of pearls. The rest stays happily abstract. It belongs to launch footage, tiny dots on tracking maps, or sentences that begin with “low-Earth orbit.” Stuff in Space takes that abstraction away in seconds. It does not build a dramatic story around the problem. It puts the problem in front of you and lets the geometry speak.
The site is an old-school web artefact in the best sense: direct, lightweight in spirit, a little raw around the edges, and quietly more memorable than a polished corporate platform. Its own description calls it a real-time 3D map of objects in Earth orbit, rendered in WebGL; it says the data refreshes daily from Space-Track and that satellite.js calculates positions. The interface distinguishes satellites, rocket bodies, and debris, then allows you to rotate, zoom, select an object, follow its orbit, search by name, or isolate groups such as GPS, Galileo, Iridium, SpaceX, collision debris, and even the strange historical cluster known as the Westford Needles.
The terrifying part is not that the screen looks crowded. It is that it looks crowded before the screen even begins telling you the full story. The dots are not to scale. Their apparent neatness conceals different altitudes, speeds, orbit types, ages, owners, purposes, and levels of danger. A tiny fragment may be visually equal to a working spacecraft. A bright icon representing an operational satellite might be close to a dead rocket body that has no way to move. The map is readable precisely because it cheats a little, enlarging what would otherwise be invisible. That cheat is honest. At real scale, you would see almost nothing. At human scale, you see the condition of the place.
The title, Stuff in Space, sounds almost childish. That is part of the project’s force. “Stuff” refuses the heroic language usually attached to orbit. It does not say orbital infrastructure, resident space objects, space-domain awareness, constellation architecture, or on-orbit assets. Those phrases exist for good reasons, especially when engineers and operators need to be exact. Yet they also make it easier to forget that a great deal of what circles Earth is simply leftover hardware. A spent stage does not become less abandoned because the spreadsheet calls it an object. A fragmentation cloud does not become less alarming because a catalog uses a clean identifier.
There is a particular kind of web experience that changes your sense of scale without asking for much time. The best examples are not necessarily large projects. They are clear windows. You open them, look for five minutes, and leave with a mental image that stays put. Stuff in Space belongs in that rare category. It turns orbital congestion from a paragraph in a report into a spatial fact. The web has always been good at bringing distant systems within reach: shipping maps, air-traffic trackers, weather radars, undersea cable maps, wildfire layers, whale migration routes, live power grids. This one may be the most unsettling because its subject is almost completely beyond ordinary human sight.
The planet looks lonely until it does not
At first glance, the globe itself is the star. Earth floats in the middle of the browser, lit against a black field that looks clean enough to invite the old fantasy of infinite room. Then your eyes adjust. The empty backdrop is doing most of the emotional work. Against it, every dot reads as evidence of intrusion. If the site had used a richly textured cosmos, neon UI panels, stock images of rockets, or a soundtrack with a low cinematic rumble, the experience would be easier to dismiss as entertainment. Its restraint is more unnerving.
Zoom out and the dots pull into bands. This is where the site stops being a novelty and begins behaving like an argument. Certain orbital altitudes thicken into visible belts. Some groups form purposeful patterns, a designed mesh of operational systems. Other areas look ragged, with objects scattered in ways that suggest history rather than planning. You are not seeing a sky full of stars. You are seeing industrial residue arranged by physics. Each object is tied to a past decision: a launch, a separation, a test, a failure, an end-of-life plan, a collision, an object that was retired but not removed.
The visual density is particularly effective because it arrives without a chart title telling you what to feel. A report may state that low-Earth orbit has become more congested. A map lets you watch congestion turn as the globe turns. It makes the point through repetition: every rotation returns more tracks, more points, more things moving above places that look peaceful below. The Earth does not appear surrounded by a halo of progress. It appears wrapped in an accidental archive.
That description should not be taken as a claim that every object on the map is immediate danger. It is not. Orbits differ greatly. Objects pass at different altitudes, inclinations, and periods; most do not come close to one another at a given moment. The orbital environment is not a single narrow lane in which every dot is fighting for the same physical point. Still, the site strips away the emotional escape hatch created by distance. A traffic jam does not need every car to touch another car before it feels crowded. What matters is that movement, planning, coordination, uncertainty, and risk all grow harder when more objects occupy limited and strategically useful regions.
ESA’s 2025 Space Environment Report, based on data through the end of 2024, gives the map’s visual impression a hard numerical edge. ESA reported roughly 40,000 tracked objects in Earth orbit, around 11,000 of them active payloads. It also estimated more than 50,000 objects larger than 10 centimetres and more than 1.2 million pieces larger than one centimetre, the latter size capable of causing catastrophic damage. The agency described certain heavily used low-Earth-orbit bands as containing active satellites and hazardous debris in the same order of magnitude.
The emotional force of Stuff in Space comes from refusing to separate the useful from the dangerous too cleanly. A working satellite is not visualised as a noble object, and debris is not visualised as a monster. They are both dots doing orbital things. That moral flatness is close to the truth of the screen. A spacecraft built for communications, climate monitoring, navigation, science, surveillance, entertainment, or emergency response may be deeply useful. Once it reaches the end of its life, though, its physical presence still needs a plan. In orbit, purpose does not dissolve automatically when the mission ends.
This is why the word “debris” can mislead people. On the ground, debris suggests litter: static, small, near enough to sweep away. Orbital debris is not static, not necessarily small, and not near enough to touch. A spent upper stage can be vast. A fragment can be too small to appear on the map yet still damaging at orbital speed. The word sounds domestic; the environment is anything but. The map does not show impact energy, uncertainty envelopes, radar cross sections, or probabilities. It shows the beginning of a correct instinct: everything up there is moving, and many things up there have outlived their purpose.
The historical layers make the experience richer. Selecting a special group is like exposing an old seam in the sky. Iridium collision debris points back to the 2009 collision between the active Iridium 33 satellite and the defunct Cosmos 2251 satellite. Westford Needles refers to a Cold War experiment that placed millions of small copper dipoles in orbit as a communications experiment. The names read almost like chapter headings from a strange history of human ambition. Stuff in Space lets you discover that history as a shape rather than a footnote.
The map also changes the way you think about a launch. Launches are often presented as singular, triumphant events: flame, countdown, separation, applause. Stuff in Space encourages a longer view. The launch is the opening scene, not the whole story. The satellite may operate for years. It may manoeuvre. It may be replaced. It may re-enter. It may fail. Its final status may become one small part of the visual clutter that future visitors stare at in mild disbelief. Every point on the map is a tiny answer to the question of what happened after the applause.
What the screen makes visible
| What you see | What it really represents | Why it stays with you |
|---|---|---|
| Dense orbital bands | Objects sharing popular altitude and inclination ranges | The sky starts to look finite |
| Bright active satellites | Working infrastructure with a physical lifespan | Convenience gains a material footprint |
| Rocket bodies | Large remnants from launch operations | The trip to orbit leaves hardware behind |
| Debris clouds | Fragmentation events, breakups, and collisions | One failure can multiply into many objects |
| Individual object tracks | A calculated path based on published orbital elements | Every dot is moving, not parked |
The table does not replace the experience; it explains why the experience lands. The site is good because it gives each of these categories a shared visual language. You do not have to understand every label before the map begins to work on you. The categories become legible through looking, then become more disturbing as you learn what they contain.
A pile of dots becomes an accusation
Stuff in Space is not trying to be an environmental campaign, yet it has the quiet moral pressure of one. The globe does not lecture. It does something sharper: it makes a system look like the consequences of its own success. Satellites have delivered real and often life-saving benefits. They are part of weather forecasting, navigation, timing systems, broadcasting, communications, disaster response, scientific observation, and much more. The map does not deny any of that. It shows the cost of treating orbit as a place with no visible edge.
This matters because the modern internet often hides material systems behind clean metaphors. Data lives in “the cloud.” A navigation app feels like a little blue arrow. Video streaming arrives as a button. A financial transaction appears as a number changing on a screen. Stuff in Space reintroduces the machinery. It reminds you that some of the services beneath a normal day depend on hardware moving at extraordinary speed above the atmosphere. The cloud has a shadow, and part of that shadow is orbital.
The project’s power is partly a matter of contrast. The browser window is familiar, almost trivial. You use the same kind of screen to read messages, check a calendar, buy a train ticket, compare prices, or lose twenty minutes to a feed. Then the tab opens onto a planet wrapped in human artefacts. The web becomes a porthole. It is hard not to feel a mild category error: why is something this large, this consequential, and this physically remote available as a simple interactive canvas?
That accessibility is not merely decorative. A difficult public problem often stays difficult because people cannot form a mental image of it. We hear counts, years, percentages, launch totals, and policy targets. Those are necessary. They are also easy to file away as somebody else’s data. A map supplies the missing object of attention. You can point to a belt. You can drag the world beneath it. You can select a fragment and see that it has an identity, a type, an apogee, a perigee, an inclination, an altitude, a velocity, a period. The invisible gains coordinates and a name.
There is an ugly honesty in the way working infrastructure and waste coexist. On a city map, a delivery van, an ambulance, a private car, and a broken-down vehicle are all recognisably different. In orbit, the visual distinction is often much thinner. A useful satellite and an object nobody can steer may share the same visual neighbourhood. That does not mean they are equivalent in value. It means they have entered the same physical problem.
The language of “space sustainability” often feels too polished for the thing it describes. It can sound like a conference track with branded tote bags. Stuff in Space gives the phrase some weight. Sustainability is not a mood in this setting. It is the practical question of whether heavily used orbital regions remain usable without growing collision risk. You do not need to turn the project into a slogan to feel that question. You only need to zoom out far enough.
ESA’s report states that fragmentation events add debris faster than natural re-entry removes it, and warns that the debris population would continue to grow even without additional launches. It describes the familiar cascading-risk idea known as Kessler syndrome: collisions create fragments, fragments increase the chance of further collisions, and some orbital regions become progressively harder to use. ESA also notes that major and smaller fragmentation events in 2024 added more than 3,000 tracked objects.
That fact changes the emotional temperature of a crowded visualisation. A dense map is not a photograph of a settled system. It is an image of a system that has a memory and a tendency. The dots are not only objects; they are future constraints. A debris cloud created decades ago may continue shaping operations long after the original mission, institution, political moment, or company branding has faded. In that sense, orbital debris is one of the web’s most literal examples of technical debt. Except the debt moves around the planet at high speed and survives many redesigns.
The site also makes clear why language about “cleaning up space” needs care. The visual experience creates an understandable desire to grab the clutter and remove it. Yet an orbital object is not a bottle floating in a harbour. Reaching it, matching its orbit, capturing it safely, changing its path, and ensuring a controlled outcome are hard engineering problems. The easy metaphor hides a hard choreography. The value of Stuff in Space is not that it offers a neat remedy. Its value is that it makes complacency difficult.
There is another subtle lesson. Human beings tend to judge crowdedness by proximity as we experience it from the ground. A packed room is packed because bodies are near each other. Orbit asks you to think in trajectories, altitudes, planes, periods, and relative motion. Stuff in Space trains your eye to see patterns without pretending you have become an orbital analyst. The site makes you more curious about the terms you did not know five minutes earlier. That is a better outcome than fake expertise.
A more polished modern product might add guided tours, achievement badges, pop-up explainers, onboarding cards, newsletter prompts, social sharing buttons, a sponsorship panel, a comparison mode, and a dashboard full of counters. Stuff in Space has the confidence to avoid most of that. It trusts the raw act of looking. The web rarely does this anymore. Many sites try to explain their own importance before they allow you to encounter the thing they are about. This site does the opposite.
Its simplicity also makes the visualisation available to different kinds of people. A teacher can use it to start a conversation about orbits without building a lecture around pages of equations. A designer can study its use of restraint. A programmer can follow the project’s open-source roots. A space enthusiast can search a familiar object. A person with no prior interest in satellites can click around until the strange density of the globe becomes impossible to ignore. Good discovery sites do not require you to arrive already converted.
The map is also a rebuke to the lazy phrase “there is plenty of space.” There is plenty of outer space in the astronomical sense. There is not limitless room in every useful orbit, at every altitude, with every inclination, under every operational constraint. The resource that feels infinite from the ground has bottlenecks from the point of view of a spacecraft. Stuff in Space does not need a policy paper to make that spatial limitation feel obvious.
The machinery behind the hypnotic view
The project works because it does not make orbital mechanics look like magic. It turns complicated calculations into a visible result, but it leaves enough of the underlying structure exposed to reward curiosity. Select an object and the interface surfaces a compact set of facts: its international designator, type, apogee, perigee, inclination, altitude, velocity, and period. These are not decorative stats. They are the bones of the moving picture.
A satellite tracker cannot simply place a fixed dot above a fixed country. An object in orbit is always somewhere else by the time you glance back at the screen. The positions seen on Stuff in Space are calculated from orbital element data, rather than pulled from a literal live camera view of every object. The project says it uses satellite.js, a web library that propagates satellite positions from TLE or OMM data using SGP4 and SDP4 methods. The library produces position and velocity information from a given epoch and time.
That distinction matters because “real-time” is a loose phrase. The view updates as your browser runs, but the quality of any calculated position depends on the orbital data and the model used to propagate it. The object is moving in real time; the public data describing its orbit has an age and a limit. This does not make the site less impressive. It makes it more interesting. The screen is not a supernatural window. It is a chain of observation, cataloguing, data publishing, mathematical propagation, code, graphics processing, and browser rendering.
Space-Track, the source named by the site, publishes satellite catalog information, general perturbation positional data, and decay or re-entry products for the unclassified catalog. Its documentation describes a TLE as a mathematical representation of a satellite’s mean orbit. It also notes limits in public tracking: some objects are too small for sensors to track consistently, some decay before enough observations exist for publication, and some data may be withheld or incomplete for security or coverage reasons.
That is why Stuff in Space is unsettling without becoming a surveillance fantasy. It does not show every bolt, every paint fleck, every fragment, or every unknown thing above Earth. It shows a tracked and published subset of a much messier physical environment. The map looks full because the known population is already full enough to trouble the eye. The untracked population changes the meaning of the screen, even when it does not appear as a dot.
The site’s interface handles the technical complexity with an unusual amount of elegance. It begins with a globe, not a spreadsheet. Yet the spreadsheet is there when you want it. Click a point and the visual object becomes a record. Search for a mission or an international designator and the map becomes a finder tool. Choose a group and the global clutter reduces into a pattern. The design moves from wonder to inspection without forcing a mode switch.
The open-source repository offers another reason to admire the project. It describes Stuff in Space as a real-time interactive WebGL visualisation of objects in Earth orbit. Its public codebase makes the project feel like a piece of the earlier web, when a person with strong technical taste could build a strange public instrument, put the code where people could inspect it, and let the work gather its own audience.
There is something charming about the project’s use of WebGL. WebGL is often associated with product demonstrations, game-like interfaces, 3D marketing pages, virtual showrooms, and visual flourishes that exist mostly to prove a company has a GPU budget. Here it earns its place. The third dimension is not cosmetic. A flat map would flatten the very fact the site needs to communicate: orbital objects occupy different planes and heights, and their movement makes more sense when you can rotate the world beneath them.
The use of Web Workers matters in the same quiet way. The site itself notes that it requires WebGL and Web Worker support. That technical requirement hints at the kind of task the browser is performing: rendering and calculation need enough separation to keep the interaction responsive. The graceful motion is not merely a visual trick; it is a small piece of computation made visible. The browser is doing work while you watch the planet turn.
A good interface often gives people only as much control as they need. Stuff in Space gives you a camera, a search field, filters, and selection. It does not bury the viewer under professional-grade controls. This is not a command centre. It is a public instrument. That distinction protects the experience. More knobs would create the false feeling that an amateur reader is now operating a serious orbital analysis system. Fewer controls would turn the map into a passive screensaver. The site lands in a useful middle ground.
It also gets the small rituals right. Dragging the globe is a familiar gesture, borrowed from maps and 3D games. Zooming out creates distance, then the visual density increases. Clicking an object creates a moment of focus. A path appears. The chosen point stops being anonymous. The interface makes curiosity feel physical. You are not simply reading about a satellite; you are pulling the planet around to find it.
The numbers in the object panel are a reminder that the elegant arcs are not decorative. Apogee and perigee reveal the high and low points of an orbit. Inclination tells you how the orbit tilts relative to Earth’s equator. Period gives a sense of how often the object goes around. Velocity gives the viewer a number large enough to break the ordinary intuition of speed. Stuff in Space does not teach orbital mechanics in a classroom sense; it creates the appetite for it.
The public data ecosystem behind this experience is itself changing. CelesTrak notes that legacy two-line element formats face catalog-number limits as more objects enter public tracking, and it points users toward newer general-perturbation formats such as OMM and JSON-compatible representations. Its documentation explains that the data originate from observations fitted to orbital models, then distributed for software to propagate. Even the humble dot on a browser map sits on top of an evolving data standard.
That technical evolution makes Stuff in Space feel more precious, not less. It is a reminder that public-facing visualisations have to keep adapting beneath the surface. The old charm of the interface does not mean the subject has stood still. The catalog grows. Data formats change. More objects arrive. Tracking methods improve. The browser remains the same familiar frame, but the sky inside that frame keeps becoming a harder place to describe.
The view is honest but never complete
A site this visually gripping invites a predictable mistake: treating the view as a direct image of every object that matters. It is better to approach it with admiration and caution. Stuff in Space is a map of published orbital data, not an operational collision-avoidance console. The difference is not pedantic. In space operations, uncertainty is part of the work. Professionals use specialised data, screening services, conjunction messages, ownership information, manoeuvre plans, and procedures that are not represented by a public visualisation.
The site’s own claim of daily updates is useful for a public experience, but “daily” should not be read as a promise of exact, current operational truth for every object at every second. Space-Track’s documentation says its general perturbation data provide the newest published element set for tracked objects, while also describing access limits, cataloguing gaps, object classifications, and practical conditions around data use. The visualisation is best understood as a living approximation of a public catalogue.
This limit does not weaken the site’s message. It sharpens it. The public map is already busy enough to disturb you; the real operational problem contains more uncertainty than the map can display. Some debris is too small to catalogue consistently. Some objects have stale data. Some are difficult to identify. Some objects decay before a full public record forms. The cleanest point on the screen may represent the messiest part of the real situation.
Scale is the other great distortion. The dots are enlarged so that human eyes can see them. Their paths may look as though they scrape across the atmosphere or pass impossibly close to one another. The Earth itself is not shown at the scale that would make every relationship visually literal. The site is an explanatory model, not a physical miniature. Its force depends on deliberate exaggeration, just as a subway map exaggerates geometry to show a network clearly.
This is worth saying because the internet has a recurring problem with striking visualisations: people share them without learning how to read them. A satellite map becomes proof that “space is packed,” then somebody else replies that the distances are huge, then the conversation stalls in a false choice. Both things are true in their own frame. Useful orbital regions are crowded in operational terms, even though the physical separations between many objects remain enormous by everyday standards. The map gives you a feeling; it needs context to turn that feeling into understanding.
NASA’s Orbital Debris Program Office exists partly because a clear picture of the environment takes much more than a public map. NASA describes its work as a combination of measurements from ground-based radars and optical telescopes, space-based sensors, and examination of returned spacecraft surfaces. It uses those measurements in modelling tools such as ORDEM and LEGEND to estimate risks and examine how the debris environment may evolve.
That is the sober counterweight to the browser experience. Stuff in Space makes the problem visible. Scientific and operational work makes the problem measurable. The public needs the first; missions depend on the second. The site should be celebrated for not pretending those roles are the same.
There is another limit that makes the project more haunting. Every object’s story is compressed. The map gives you a name, a type, an orbit, sometimes a clue in the launch designation. It does not give you the whole chain of decisions that placed the object there. A single dot may contain a technical achievement, a commercial gamble, a national programme, a research mission, a failure, an accident, or a quiet administrative choice about disposal. The visual system cannot carry all that history, but it provokes you to go looking for it.
This compression is familiar from other global maps. A ship tracker rarely tells you the labour conditions aboard a vessel. A flight map rarely shows the political agreements, fuel systems, maintenance schedules, or airport economies behind a route. A live electricity map does not tell you how a community fought over a power plant. Stuff in Space makes one layer visible, then leaves the rest in the dark. Its strength lies in making that layer impossible to ignore, not in claiming to be the entire story.
The aesthetic danger is that orbital debris can become beautiful. A dense belt of moving dots around a blue globe has the visual grammar of a digital artwork. It looks like an album cover, a museum installation, a title sequence, or a carefully designed data sculpture. Beauty is part of the trap. The screen can seduce you into watching longer than a warning label ever could. Then, while you are admiring the motion, the content of the motion arrives: much of this is infrastructure, but much of it is abandoned matter.
That tension is not a flaw. It is why the site works. A purely ugly visualisation might prompt a quick moral response and then disappear from memory. Stuff in Space makes the accumulation look fascinating enough that you stay. The fascination gives the unease time to develop. You begin by exploring. You end by wondering how a physical environment above Earth became so easy to use and so hard to tidy.
The site also refuses the simplification that debris equals negligence and satellites equal virtue. Some debris comes from historical practices that were widely accepted at the time. Some failures are hard to prevent. Some operational spacecraft are part of growing systems that will create their own end-of-life pressures. Some operators take disposal seriously. Some do not. The map does not sort anyone into heroes and villains. It sorts objects into orbital positions. That is a tougher and more useful starting point.
ESA’s 2025 report notes improvement in debris-mitigation compliance, including more re-entries and stronger practices in parts of the commercial sector, while also stating that progress is still insufficient to stop the debris population from growing. It highlights the need to remove spacecraft from congested orbits, prevent breakups through measures such as passivation, and pursue active debris removal for long-term stability.
The honest response after opening Stuff in Space is neither panic nor dismissal. Panic turns a complicated risk environment into disaster theatre. Dismissal treats a crowded sky as somebody else’s infrastructure problem. The better response is a durable discomfort. The map should stay in your head when you hear a launch announced, when you use a navigation app, when a satellite internet company celebrates growth, or when a story about a near miss appears and then vanishes from the feed.
A good website knows when to stay out of the way
Stuff in Space has survived in people’s memory because it does not chase the usual logic of web products. It does not try to become your daily dashboard. It does not demand an account. It does not use a social graph to turn the sky into an engagement loop. It gives you a strange capability and lets you decide what to do with it. That is an increasingly rare kind of generosity online.
The experience also benefits from a slight roughness. Contemporary web design often smooths every surface until a site feels like a showroom. Every button has a soft shadow. Every word carries brand voice. Every empty state contains a joke. Every interaction asks to be admired. Stuff in Space feels closer to a useful machine. It has personality because it is not performing personality. The visual identity comes from the subject: Earth, orbit lines, coloured objects, black space, simple labels.
That does not mean the interface is careless. Its choices are carefully proportioned. The globe remains dominant. The controls do not fight it. Object information stays compact. Filters exist without becoming a giant taxonomy. Search is there for people who know what they are looking for, while browsing remains rewarding for people who do not. The design behaves like a map, not a magazine.
This is a useful lesson for web builders. When the underlying object is compelling enough, you do not need to wrap it in constant explanation. A map of global power cuts needs a map. A visualisation of ancient manuscript routes needs a map. A site about the objects circling Earth needs a globe. The form does not need to be clever when it is already correct. Stuff in Space understands that its central visual metaphor is not a metaphor at all. The globe is the interface because the globe is the subject.
The project also handles discovery well. You may arrive after seeing a screenshot on social media, a clip in a short video, an old blog post, a classroom link, or a friend’s message that says, “You need to see this.” The site pays off that handoff immediately. There is no long preamble between curiosity and reward. You click, wait for the data to load, and confront the planet.
That immediate payoff gives the project a shareable quality that is more durable than a viral format. It does not rely on a joke that expires. It relies on a fact that becomes more striking as the viewer understands it. The best internet discoveries make you send a link with fewer words, not more. “Look at this” is enough because the site carries the feeling on its own.
The project’s age adds another layer of appeal. The web has changed dramatically since early browser-based visualisations like this began circulating. We now expect interactive 3D scenes in product launches, games in messaging apps, and maps embedded in almost every service. Yet Stuff in Space still carries a particular early-web wonder: the feeling that somebody made a small door into a huge system and left it open. There is no need to turn that nostalgia into a claim that the past was better. The point is that the project still feels unusually direct.
Its open-source availability reinforces that feeling. You can see that the tool is not a sealed black box owned by a platform that treats visibility as a subscription tier. The GitHub repository presents the project as a public interactive WebGL visualisation. That transparency matters even for people who never read a line of code. A public instrument feels different when its construction is not hidden behind an opaque product wall.
There is a broader design principle here: a serious subject does not always need a serious-looking surface. A project about orbital debris could easily become visually bureaucratic, packed with warning colours, acronyms, dropdowns, and reports. Stuff in Space keeps the mood closer to wonder. The seriousness arrives through attention, not through intimidation. It trusts users to feel the implications once they are given something real to look at.
The lack of explanatory overload also gives the site a strange emotional neutrality. It does not tell you to be afraid. It does not tell you to be hopeful. It does not tell you who is responsible. It does not tell you which solution to support. It leaves room for your own reaction, which is why the reaction tends to be stronger. A polished campaign often anticipates your feelings for you. This map does not.
That openness makes the site useful in conversations where people begin from different levels of knowledge. Someone who knows nothing about orbital dynamics may simply feel shock. Someone with technical experience may inspect particular orbital patterns. A policy-minded reader may think about governance. A designer may focus on the strange calm of the interface. The same page supports different kinds of attention without splitting into different products.
The map is also good at making silence noticeable. Space is silent in the physical sense that sound does not travel through a vacuum, but the site produces another kind of silence: the absence of narration. No voiceover tells you when to react. No soundtrack turns fragments into drama. No animated counter tells you the number is rising while you watch. The dots move, the world turns, and your own thoughts fill in the noise.
That restraint feels almost radical in an internet economy built around keeping you stimulated. Stuff in Space holds attention by letting the subject remain strange. It does not flatten orbital debris into content. It preserves the distance between a human viewer and an environment that humans made but cannot casually visit. The result is not alienating. It is sobering.
Stuff in Space changes the texture of looking up
After you spend time with the map, the night sky does not quite return to normal. A clear evening becomes less empty, even when you cannot identify a single object. The stars remain stars, the Moon remains the Moon, aircraft lights still move with their own familiar rhythm. Yet the mental picture behind the sky has changed. You know that above the atmosphere, beyond what your eyes can sort out, a dense and complicated population of human-made objects is passing overhead.
That is the site’s real accomplishment. It does not need to make you a satellite tracker. It changes your default image of Earth. Many people carry an old image from schoolbooks and space photographs: a blue marble, cleanly isolated, exquisite against a black background. Stuff in Space adds the missing layer. It is still a blue marble, but it is no longer visually alone.
The emotional effect is close to seeing a city from above at night and suddenly understanding how much infrastructure sits behind ordinary life. Roads become arteries. Ports become glowing circuits. Airports become patterns of motion. Stuff in Space gives orbit the same treatment. The sky stops being backdrop and starts looking like a built environment. Not built in the sense of buildings or streets, but built through accumulated hardware, standards, launch systems, databases, contracts, failures, repairs, and choices.
The web is especially good at this kind of revelation when it stays close to a subject. A broad explainer about space debris may teach you facts. A museum exhibition may give you a beautiful object. A government report may give you rigorous evidence. Stuff in Space gives you a place to stare. That difference matters. Attention is not always a matter of being told more. Sometimes it comes from being shown the right thing at the right scale.
There is a useful discomfort in the phrase “right scale.” The map is not physically to scale, yet it is psychologically closer to the truth than the empty-sky image most of us carry. It exaggerates objects so you can see them, compresses distance so you can understand the population, and puts the Earth at the centre so the consequences feel local. It is visually false in ways that make a larger truth easier to grasp.
That is what strong visual communication often does. A weather map colours air masses that do not have literal coloured edges. A transit map bends geography into clarity. A medical illustration enlarges a structure until a student can understand it. Stuff in Space enlarges the visible problem of orbit. The accuracy lies in the relationships it makes legible, not in pretending your browser is a spacecraft window.
Its quiet terror comes from the absence of a final frame. There is no closing card that says the problem is solved. There is no friendly scroll ending that converts concern into a shopping choice. There is no completed quest. You leave with the same question you arrived with, only heavier: what happens when an environment becomes crucial to daily life faster than our habits for maintaining it mature?
ESA’s current public reporting gives that question urgency without turning it into melodrama. The agency says that even with no new launches, fragmentation could keep the debris population growing, and it argues that mitigation alone is no longer enough in certain scenarios. It has also pushed a Zero Debris approach and stricter practices around disposal, passivation, and removal.
The useful thing about Stuff in Space is that it does not let such language float above your head. Before the map, “mitigation” is a word. After the map, mitigation is the difference between another clean orbital path and another thread in a crowded visual field. “End of life” stops sounding like paperwork. “Fragmentation event” stops sounding like a technical phrase. You have seen what a cloud of labelled debris looks like when it is allowed to stay in the story.
A person could spend hours on the site. You could search missions, follow old fragments, compare groups, watch the bands from different camera angles, and lose yourself in the strange topology of Earth orbit. You could also spend two minutes there and get the point. That economy is a mark of a good web experience. It offers depth without demanding it, then rewards the reader who keeps digging.
The project deserves to be called a hidden internet gem even though it has circulated for years. “Hidden” does not have to mean unknown to everyone. It can mean a site that has not been absorbed into the ordinary toolbox, a place that continues to surprise people who should have found it earlier. Stuff in Space feels newly discovered every time somebody sees it for the first time. The map’s impact does not depend on novelty in the technical sense. It depends on the gap between our daily dependence on orbital systems and our weak intuition for what orbit looks like.
There is a tender irony in that gap. Human beings have built instruments capable of tracking, cataloguing, modelling, and visualising objects thousands of kilometres above the ground. We can put that visualisation in a browser. We can rotate a representation of Earth with our fingers. Yet the act still produces astonishment. The system is technically familiar enough to render, emotionally strange enough to unsettle.
Stuff in Space is worth opening because it gives the internet a job it performs beautifully: bringing a hidden system into view without pretending to reduce it to a simple answer. It is a map, an educational object, a technical demonstration, a warning, and a minor work of digital art. More than anything, it is a corrective to the idea that the space around Earth is a blank page. We have been writing on that page for decades. The writing is now visible from very far away.
Things people usually ask after opening Stuff in Space
The objects move in real time on the page, but their positions are calculated from publicly available orbital data rather than shown through a live camera feed.
No. It shows catalogued public data. Many smaller fragments cannot be tracked consistently, and some orbital records are limited or withheld.
No. The view compresses enormous distances and enlarges objects so they can be seen. Yet the growing population makes tracking, manoeuvring, and long-term orbit management harder.
Old satellites, rocket bodies, mission hardware, collisions, and breakups all leave material behind. Some objects re-enter naturally; others remain in orbit for years or decades.
Because it shows Earth’s useful orbital neighbourhood as it really is: not empty, but populated by working infrastructure and its leftovers.
Author:
Jan Bielik
CEO & Founder of Webiano Digital & Marketing Agency
This article is an original analysis supported by the sources cited below
Stuff in Space
The live WebGL visualisation, its interface, object categories, daily Space-Track update statement, and public description of how it calculates object positions.
StuffInSpace on GitHub
The project’s public repository, describing it as a real-time interactive WebGL visualisation of objects in Earth orbit.
ESA Space Environment Report 2025
ESA’s report on tracked objects, debris populations, fragmentation events, crowded low-Earth orbits, mitigation, and long-term orbital risk.
Space-Track documentation
Documentation for the public satellite catalogue, general perturbation data, orbital element sets, tracking limits, and conjunction-related services.
Satellite.js
The propagation library cited by Stuff in Space for calculating satellite positions from TLE and OMM orbital data.
NASA Orbital Debris Program Office
NASA’s overview of debris measurement, modelling, risk estimation, and long-term orbital-environment research.